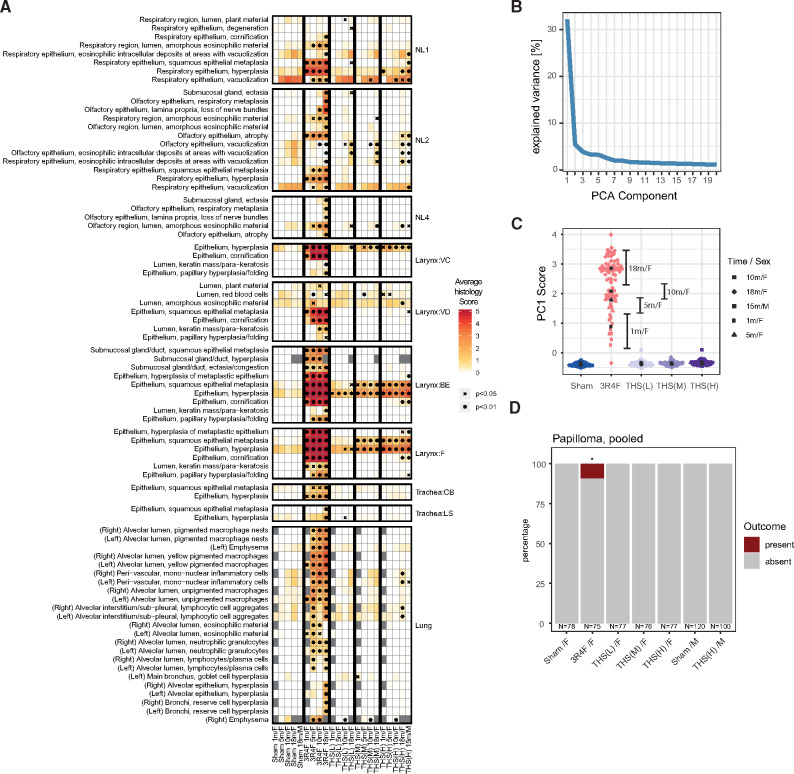
Figure 2.
Tobacco Heating System (THS) 2.2 aerosol exposure induces fewer tissue alterations in the respiratory tract than cigarette smoke exposure. A, Histology score profiles. Average histology scores are color coded for each endpoint (rows) and exposure group (columns) (see color key). Histology scores reflect semi-quantitative severity grading: 0, within normal limits; 1–5, minimal to severe changes. Statistical significance versus sham is indicated: xp < .05; *p < .01. Histological endpoints are grouped by region of the respiratory tract: nose levels 1–4 (NL1–NL4), laryngeal regions (VC, vocal cords; VD, ventral depression; BE, base of the epiglottis; F, floor), tracheal regions (CB, carina of bifurcation; LS, longitudinal section), and the lungs. Endpoint with significant changes versus sham for any group is shown. B, Variance explained by the components of a (ordinal) principal component (PC) model for the histology scores. C, Scores for each sample/animal on the first PC. Shape of the points indicates time point and sex (see key). See Supplementary Figure 1 for PCs 2–5. D, Pooled papilloma incidence across various regions of the larynx.*p < .05.

