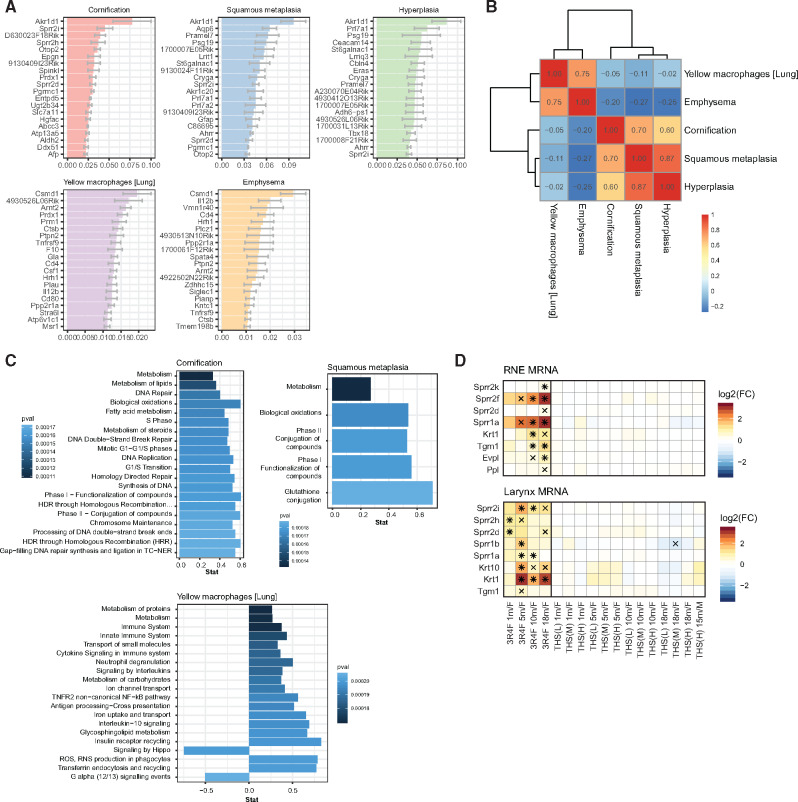
Figure 6.
Tobacco Heating System (THS) 2.2 aerosol induces fewer adaptive tissue adaptations in the respiratory tract than cigarette smoke. (A) Association between gene expression profiles and histological changes in the respiratory tract. Mean ± standard error of the mean of coefficients for the regularized ordinal logistic regression model linking the indicated histology endpoints to gene expression across the respiratory tissues (top 20). B, Clustered Pearson correlation heatmap for the mean coefficients of the ordinal logistic regression model. C, Top enriched gene sets (by p-value) for mean coefficients of the ordinal logistic regression models (filtered for false discovery rate [FDR] < 0.05; maximum 20 gene sets shown). See Supplementary Figure 4 for emphysema and hyperplasia. D, Gene expression profiles for cornification-related genes in respiratory nasal epithelium (RNE) and the trachea. Log2 fold changes (FCs) versus sham are color coded, and statistical significance is indicated: *FDR-adjusted p-value < .01; xFDR adjusted p-value < .05. Cornified cell envelope-related genes were obtained from a previous publication (Kalinin et al. 2001).

