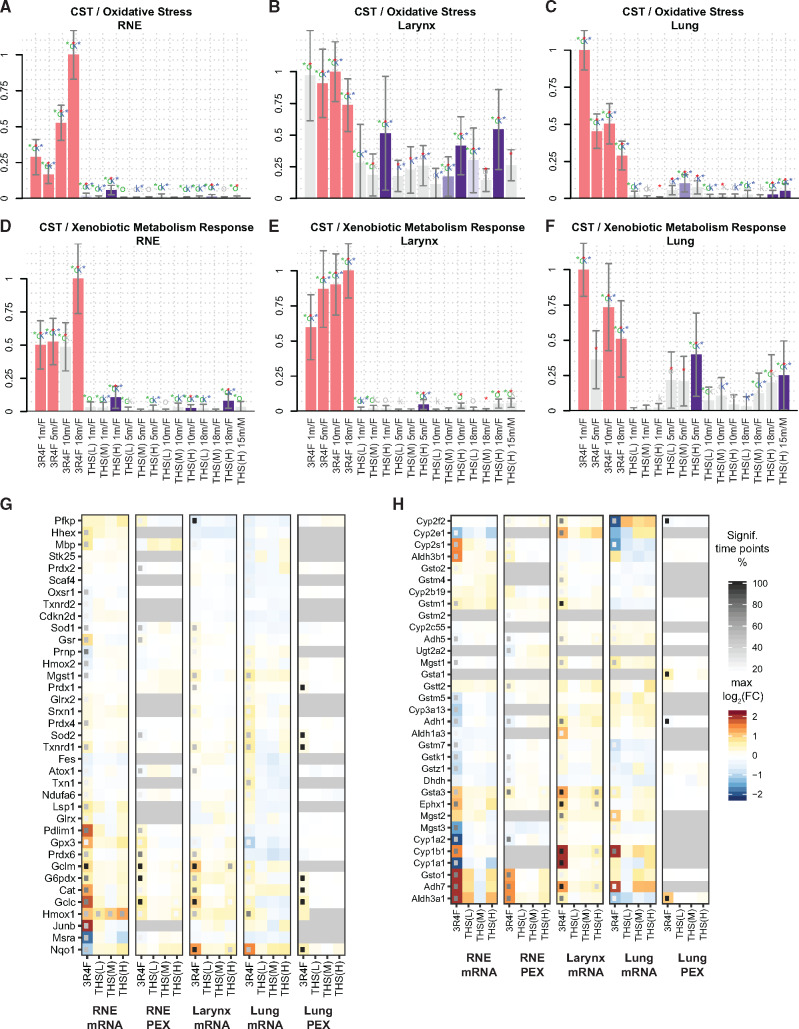
Figure 9.
Tobacco Heating System (THS) 2.2 aerosol induces fewer cell stress responses in the respiratory tract than cigarette smoke. Perturbation of the oxidative stress (A–C) and xenobiotic metabolism response (D–F) networks in the respiratory nasal epithelium (RNE) (A, D), trachea (B, E), and lungs (C, F). The bars show the overall network perturbation amplitude calculated from transcriptomic data. See caption of Figure 7A for details. (G) Tissue expression profile for oxidative stress response genes/proteins. See caption of Figure 4D for details. Genes are part of the reactive oxygen species pathway of the mSigDB hallmark collection (Liberzon et al. 2015). See Supplementary Figure 8 for detailed expression responses. (H) Tissue expression profile for xenobiotic metabolism genes/proteins. Genes are part of the metabolism of xenobiotics by cytochrome P450 gene set from the KEGG database (Kanehisa et al. 2019). See Supplementary Figure 9 for detailed expression responses. CST, cell stress; FC, fold change; PEX, protein expression.

