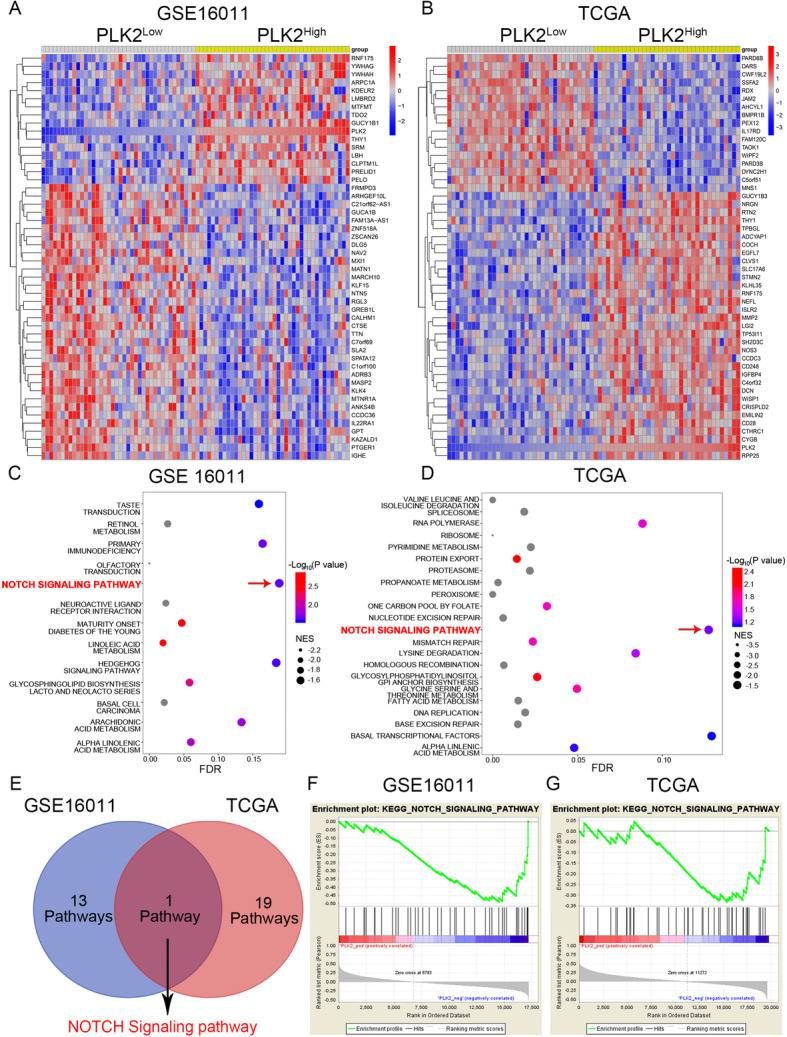
Fig. 5.

Loss of PLK2 enhances TMZ resistance of GBM via activation of Notch signaling. a and b, Hierarchical bi-clustering analysis was performed by using GEO database (GSE16011) or TCGA GBM database, indicating the significant gene signature in PLK2high GBM compared with PLK2low GBM. c and d, Bubble plots were carried out to illustrate the results of GSEA analyses using the transcriptome profiles of GSE16011 and TCGA GBM, indicating that PLK2 was negatively correlated with these pathways. e, Venn diagram of all significantly enriched pathways that are negatively correlated with PLK2 from GSEA analyses, showing Notch signaling pathway was the only common pathway that is negatively correlated with PLK2. f, GSEA plot showed the negative correlation between PLK2 and Notch signaling pathway
