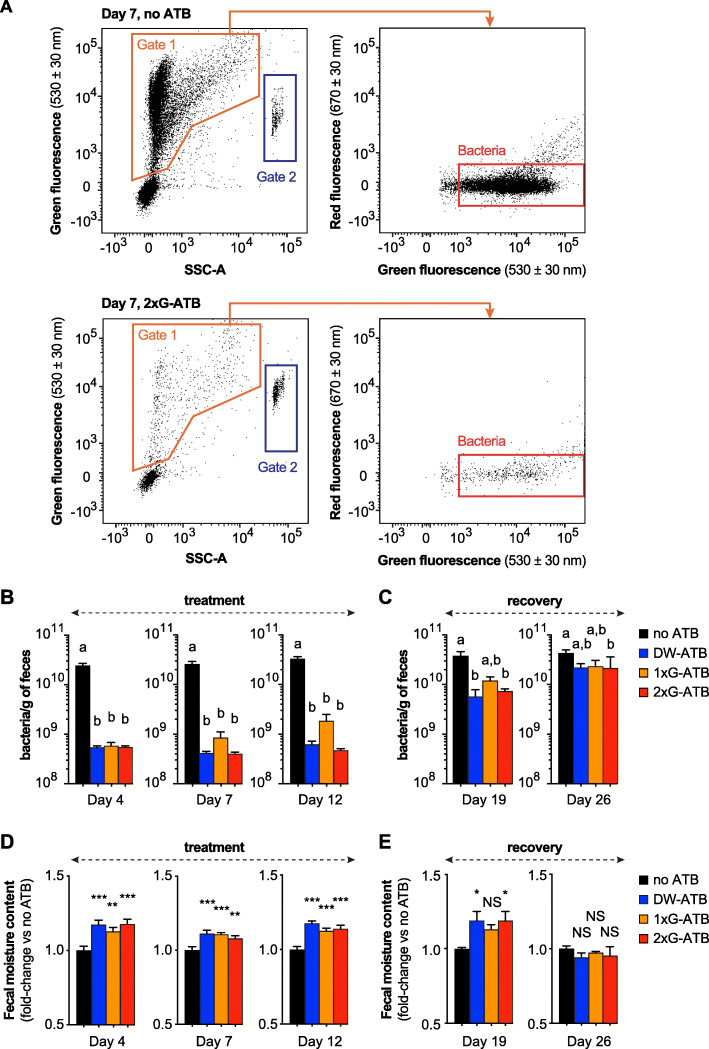
Fig. 1.
Effect of antibiotics on fecal bacterial density and fecal moisture content in mice. a Flow cytometry gating strategy for quantification of bacterial densities. Acquisition plots for fecal samples from untreated mice (no ATB; top) and mice treated with antibiotics by oral gavage twice a day during 1 week (2xG-ATB; bottom) are represented. A first gate was defined based on green fluorescence/SSC-A channels to exclude debris or background events (gate 1). A secondary gating was performed on events from gate 1 to count bacteria and to exclude events with low green fluorescence and high red auto-fluorescence intensities. The volume analyzed by the flow cytometer for each sample was determined by quantifying the number of calibrating beads detected in gate 2. b Flow cytometry-based quantification of bacterial density in mice feces during antibiotic treatment (means ± SEMs, n = 12–15; Kruskal-Wallis test with Dunn’s correction). c Flow cytometry-based quantification of bacterial density in mice feces during recovery from antibiotic treatment (means ± SEMs, n = 9–10; Kruskal-Wallis test with Dunn’s correction). d Moisture content in mice feces during antibiotic treatment (values are expressed as fold-change compared to untreated mice; means ± SEMs, n = 12–15; one-way ANOVA with Holm-Sidak’s correction). e Moisture content in mice feces during recovery from antibiotic treatment (values are expressed as fold-change compared to untreated mice; means ± SEMs, n = 8–10; one-way ANOVA with Holm-Sidak’s correction). Labeled plots without a common letter differ; P < 0.05; *, P < 0.05 versus “no ATB” group; **, P < 0.01; ***, P < 0.001; NS, not significant

