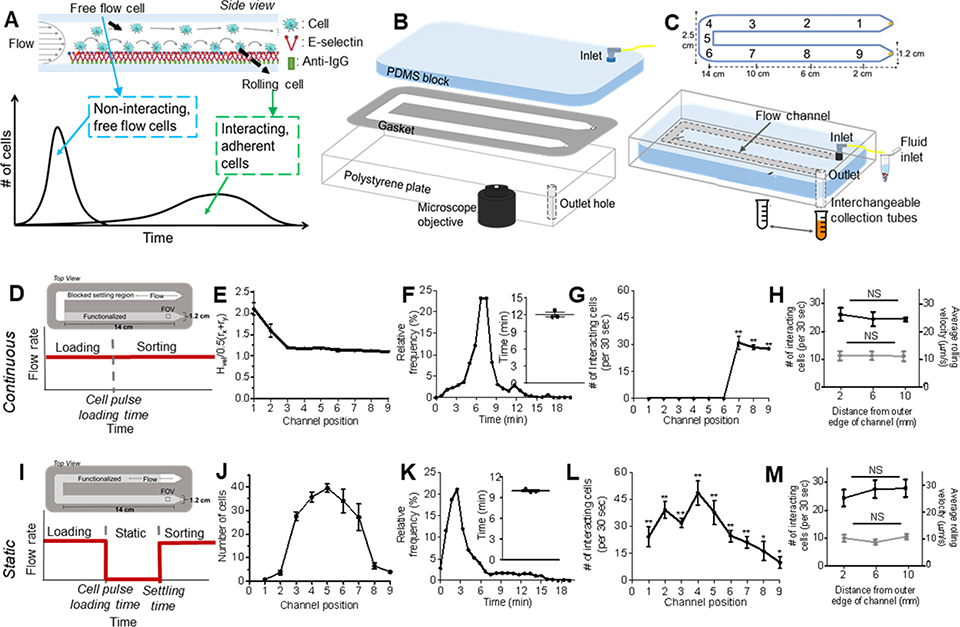
Figure 1. Engineered cell sorting adhesion chromatography microfluidic to investigate cancer metastasis in vitro.
(A) Elution profiles of LS174T metastatic colon carcinoma cell populations when perfused over E-selectin, demonstrating the early elution of free flow cells followed by subsequent elution of adherent cells. (B) Hemodynamic microenvironment-mimicking, parallel-plate microfluidic fabrication, into which (C, bottom) metastatic cancer cells are infused into the E-selectin functionalized channel, visualized via an integrated high speed videomicroscopy, and collected into collection tubes based on channel residence time. (D-H) Continuous perfusion experiments, (I-M) Static perfusion experiments. (D,I) Channel functionalization schematic and perfusion workflow diagram. (E) Distance of individual perfused cells from the channel bottom calculated based on measured individual cell velocity and size decreases from the inlet (channel position 1) until reaching channel position 3 after which it is uniform throughout the remaining channel length. Data represent mean ± s.e.m. (F,K) Representative relative frequency distribution of elution time of the infused cell pulse with the inset showing the mean time at which 95% of the cell pulse has eluted ± s.e.m. (G,L) Number of interacting cells along the length of the channel during the sorting phase. Data represent mean ± s.e.m. (H,M) Number of interacting cells along the width of the channel (black) and average velocity of rolling cells along the width of the channel (gray). Data represent mean ± s.e.m. (J) Location of cell pulse during static phase of Static perfusion experiments (E-H,J-M) Each point represents the mean ± s.e.m. of n≥5 independently run experiments. Cell pulse of LS174T colon carcinoma cells perfused at 1 dyn cm−2 over (E,G,I,K) 2.5 ug mL−1 E-selectin or (F,J) unfunctionalized channels. * p < 0.05 ** p<0.01 compared to unfunctionalized channel (no interacting cells) by one-sample t-test.

