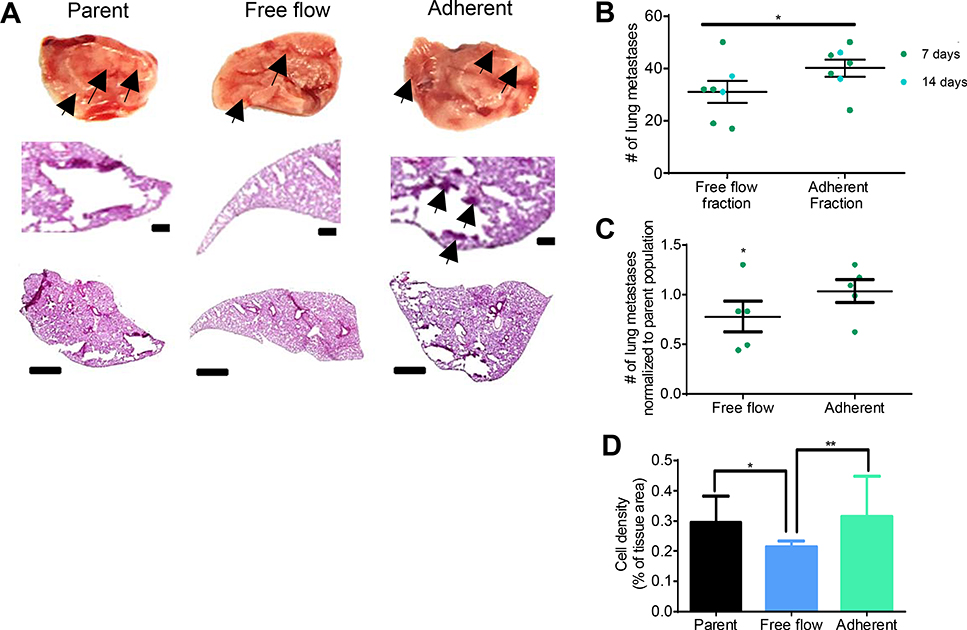
Figure 3. LS174T cells collected using adhesion chromatography in the Free flow fraction metastasize in vivo less than Adherent fraction.
(A) Representative bright field and chromogenic images of NSG mouse whole lobes and lung sections and 7 d post intravenous (i.v.) infusion of parent (unsorted) or sorted free flow or adherent LS174T cells. Arrows indicate metastatic tumors. Scale bars, 100 μm or 1 mm in regions of interest and whole lobe images, respectively. (B) Lung metastasis count in lungs dissected from NSG mice either 7 or 14 d post i.v. infusion of collected LS174T free flow cells or adherent cells. (C) Count of lung metastases in either the free flow group or the adherent group normalized to the mean number of lung metastases per NSG mouse in the parent (unsorted) group 7 d post i.v. infusion. (D) Quantification of hematoxylin and eosin staining for each group. (A-D) Perfusion and separation of an LS174T cell pulse of 250,000 cells was over 2.5 μg mL−1 E-selectin at 1 dyn cm−2. NSG mice were injected i.v. with 105 LS174T cells. (B-C) Each point represent an individual mouse lung. Bars represent mean ± s.e.m. of n≥5 individual mice. (B) * p < 0.05 by two sample t-test. (C) * p < 0.05 by t-test Ho: μ= 1 (D) Bars represent mean ± SEM of independent samples. Analyzed with a one-way ANOVA with post hoc t-test with Bonferonni corrections for multiple comparisons * p < 0.05 ** p < 0.01

