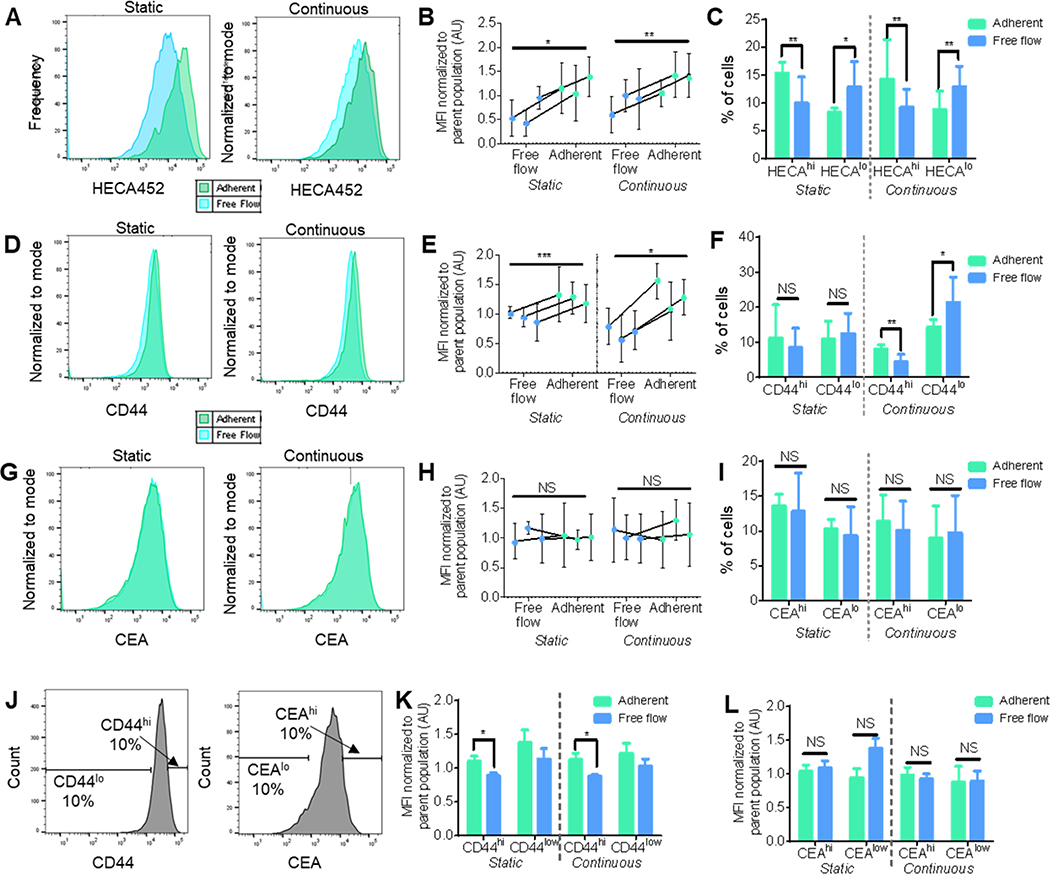
Figure 4. LS174T cells collected using adhesion chromatrography into Adherent subpopulation after perfusion over E-selectin exhibits enhanced HECA and CD44, but not CEA, expression levels.
(A,D,G) Representative flow cytometric histograms of sLex (HECA452), CD44, or CEA expression. (B,E,H) sLex (HECA452), CD44, or CEA expression normalized to the parent population between cells in the collected free flow fraction and adherent fraction. Each point represents the mean fluorescent intensity of analyzed cells ± s.e.m. (C,F,I) Percent of cells in each fraction that are in the top 10% or bottom 10% of sLex (HECA), CD44, or CEA expressing cells. Each bar represents the mean ± s.e.m. of n≥3 individually run experiments. (J) Representative flow cytometry gating and analysis strategy for (K,L) sLex (HECA452) expression levels normalized to the unsorted parent LS174T cell population in either high (top 10%) or low (bottom 10%) expressing subpopulations of (K) CD44 or (L) CEA. Each bar represents the mean ± s.e.m. of n≥3 individually run experiments. Perfusion and separation of an LS174T cell pulse of 250,000 cells was over 2.5 μg mL−1 E-selectin at 1 dyn cm−2. * p < 0.05 ** p < 0.01 *** p, 0.001 by paired t-test.

