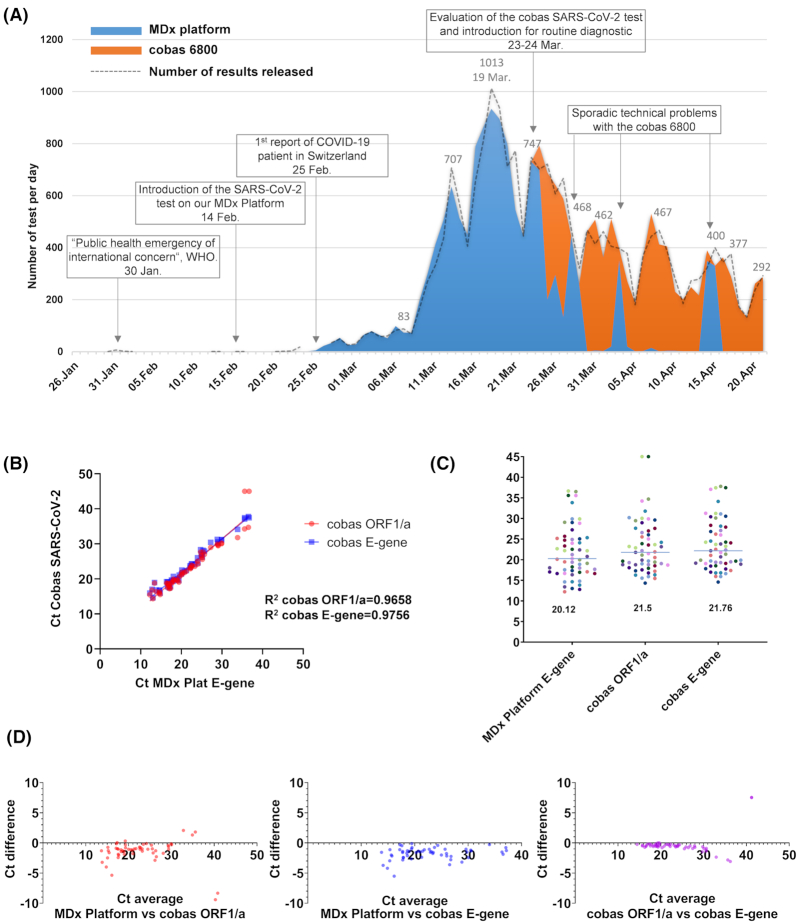
Figure 1.
SARS-CoV-2 detection using our in-house automated molecular diagnostic platform and the cobas the SARS-CoV-2 test in our laboratory. (A) Use of the in-house automated molecular diagnostic platform (blue) and the cobas the SARS-CoV-2 test (orange) during the course of the epidemic; the area represent the number of tests achieved per days while the dash line represent the results validated. Indeed, in some cases the analysis run started at J0 just before midnight and was validated at J+1. (B) Cycle threshold (Ct) values of the molecular diagnostic platform and of the cobas SARS-CoV-2 test. (C) Median of the Ct value of the molecular diagnostic platform and of the cobas SARS-CoV-2 test obtained for positive results (n = 55) (D) Bland–Altman graphic showing the (difference versus average) to compare the Ct value of the molecular diagnostic platform and of the cobas SARS-CoV-2 test.

