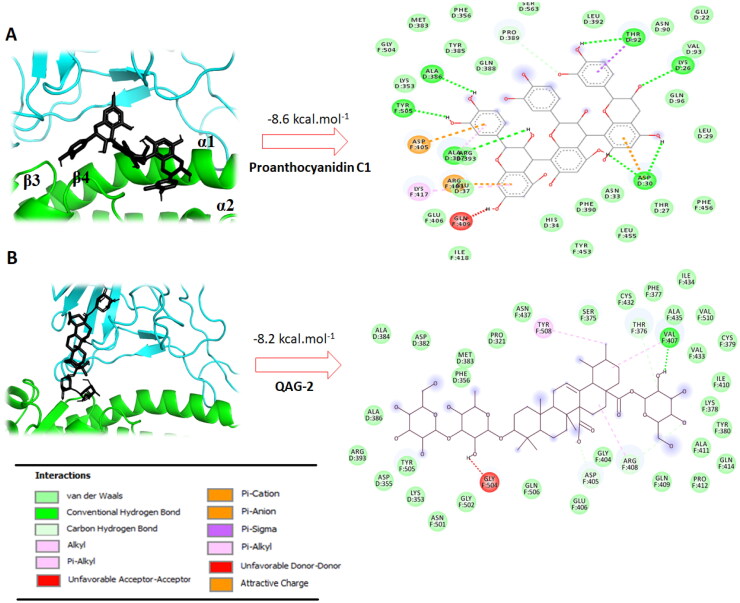
Figure 3.
A,B: The best conformation of the Proanthocyanidin C1 (A) and QAG-2 (B) within ACE-2–RBD interface (PDB: 6M17). 2D interaction mode plots between the selected compounds to the ACE-2–RBD complex. Interactions between each component and amino acids residues into ACE-2–RBD binding domain are indicated by the dashed lines. D and F into circles indicated ACE-2 and Spike proteins, respectively.

