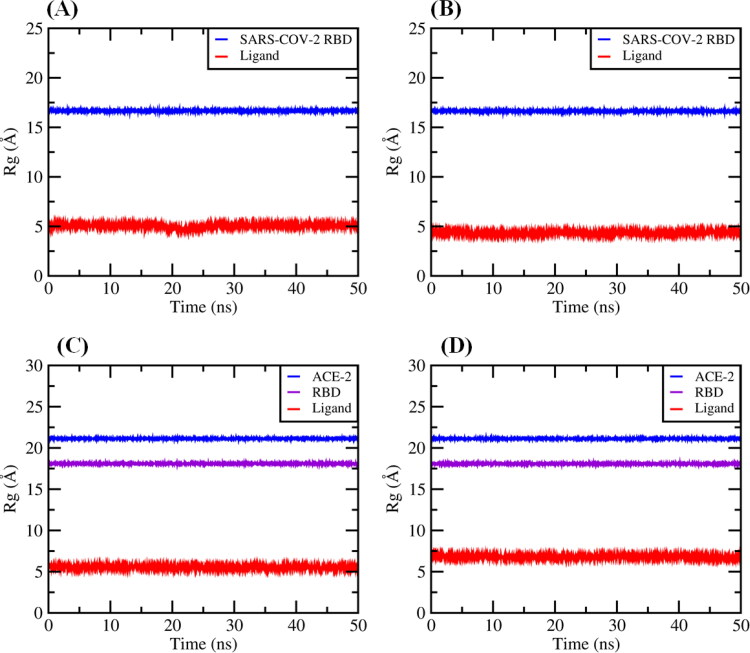
Figure 9.
Radius of gyration (Rg) graphs: (A) for 3-dihydrocadambine into the binding cavity (red) and SARS-CoV-2 spike protein without ligand (blue). B: For Proanthocyanidin B2 onto active site (red) and SARS-CoV-2 spike protein without ligand (blue). C: For Proanthocyanidin C1 within binding cleft and RBD/ACE-2 complex without ligand (blue and violet). D: for QAG-2 into the binding site (red) and RBD/ACE-2 complex without ligand (blue and violet).

