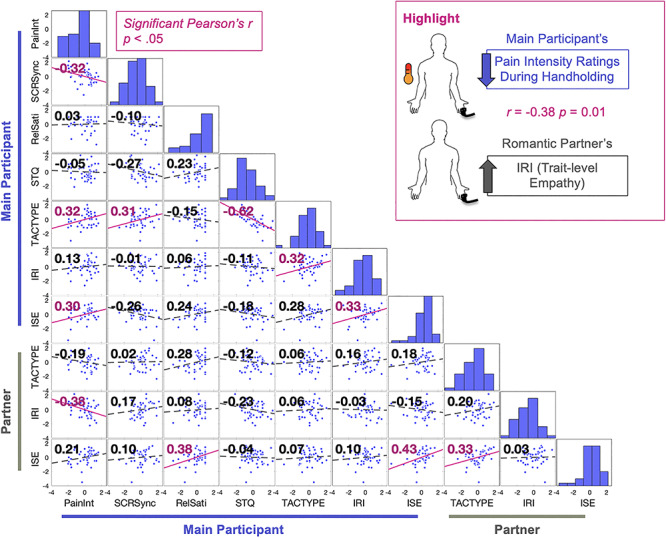
Fig. 5.

Individual differences in interpersonal tendencies and beliefs are related to handholding analgesia. To explore relationships among the effect of Handholding on pain and synchrony with an individual’s empathic traits, enjoyment of touch and perceptions of support in their lives, we computed a pairwise Pearson’s correlation matrix using participant survey data as well as their average pain reports and SCR synchrony during Handholding. This plot focuses on Handholding because Handholding had the largest effect on pain reports and physiology. Pearson’s r values are on the top left corner of each plot. Significant correlations in pink. Significance threshold set at P < 0.05 uncorrected. Frequency histograms are plotted on the diagonal. For the purpose of this plot, the data were z-scored to standardize the range of data for easier viewing. Legend: PainInt, average pain intensity ratings during Handholding; SCRsync, average couple SCR synchrony during Handholding; RelSatis, Relationship Satisfaction; STQ, Social Touch Questionnaire; TACTYPE, attitudes about touch; IRI, Interpersonal reactivity index (empathy); ISE, Interpersonal Support Evaluation.
