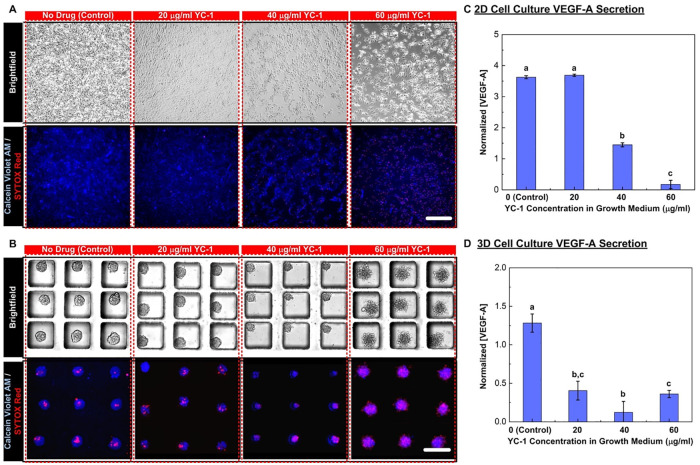
Fig 6. Growth of cell monolayers and 3D spheroids under different concentrations of HIF inhibitor YC-1 in growth media.
The treatment groups include samples cultured in growth media containing 20, 40 and 60 mg/ml of YC-1 while samples grown without YC-1 is control group. (A) and (B) show the brightfield and fluorescence images collected for estimation of cell viability for monolayer and 3D spheroid cell cultures, respectively. The cells are stained with Calcein Violet AM as a live cell marker and Sytox Red as an apoptotic cell marker. Scale bar is 200 μm. (C) and (D) show the VEGF-A concentrations and the amount of VEGF-A secreted from single cells measured at Day 4 normalized to those at Day 2 from the conditioned medium collected from the monolayer and 3D spheroid cell culture, respectively. Data are presented as mean±s.e.m. One-way ANOVA is performed for statistical analysis, and the data with statistically significant difference are labelled with different letters (a, b, c = p <0.05).

