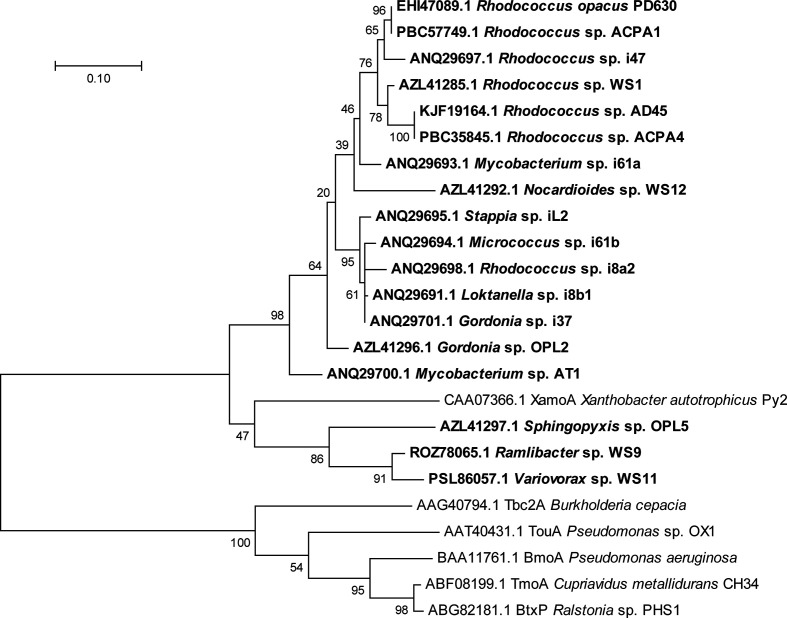
Fig. 5.
Phylogenetic tree showing the relationship of IsoA from isoprene-degrading bacteria (shown in bold type), together with homologous sequences from characterized bacteria that do not degrade isoprene, constructed using the maximum-likelihood method in mega 7 [88]. Positions containing gaps or missing data were removed, and the final alignment comprised 334 amino acids. Bootstrap values (500 replications) are shown at the nodes and the scale bar indicates substitutions per site.

