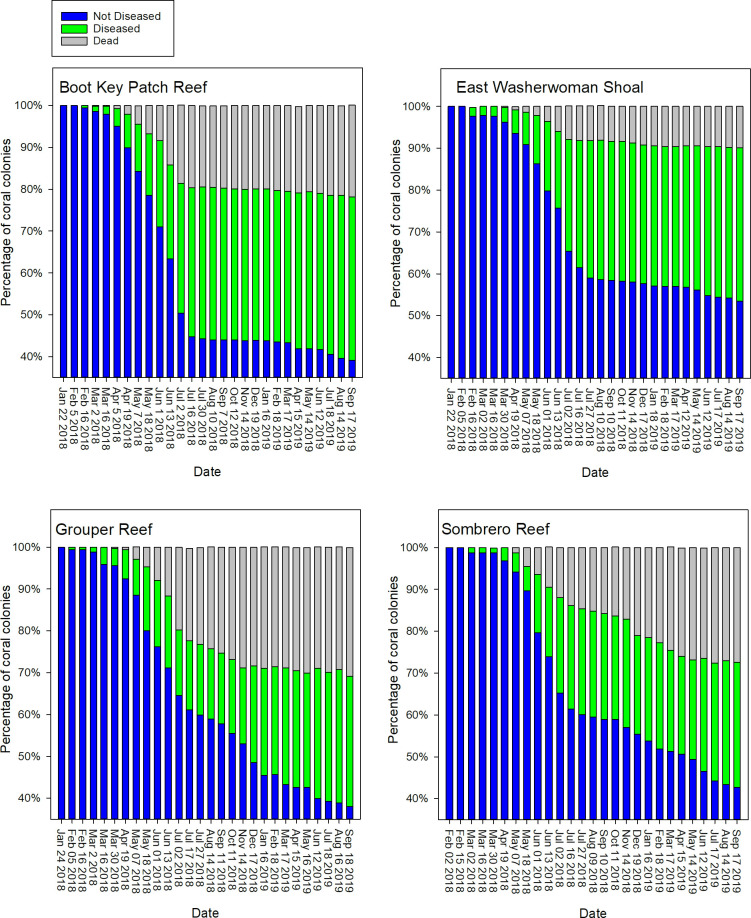
Fig 5. Time series of the disease status of coral colonies.
Status is defined as: i) not diseased, ii) diseased, and iii) dead. Status is summarized as the percent of total colonies per site from late January 2018 through mid-September 2019. Observations were made bimonthly through July 2018 and monthly thereafter.

