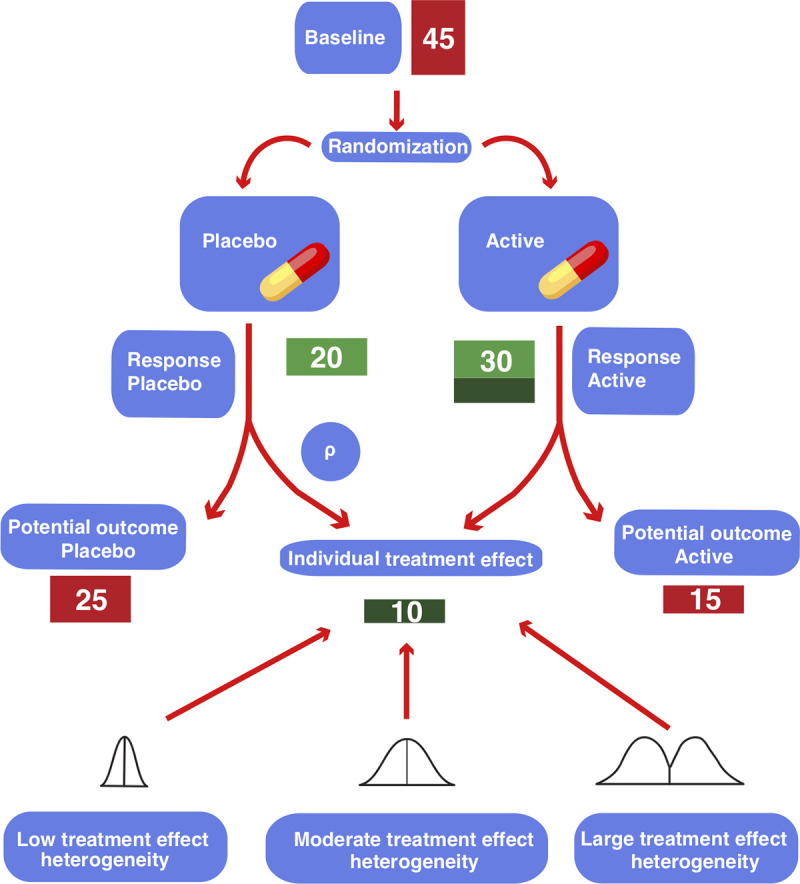
Fig 1. Visualization of potential outcomes and treatment effect for a patient in an antidepressant trial.

The patient is randomized to either the placebo or the active arm, corresponding to two hypothetical “potential outcomes” (Red scores). Only one outcome can be observed, as a patient cannot receive both interventions simultaneously. The difference between the two outcomes is the “individual treatment effect” of the intervention (Dark green score). The individual treatment effect is unobservable and can be imaged to be drawn from hypothetical distributions of the treatment effect. The variance of this distribution corresponds to the treatment effect heterogeneity. The factor ρ is the correlation between the placebo response and the individual treatment effect. All numbers signify depression severity on the HAMD-17 scale.
