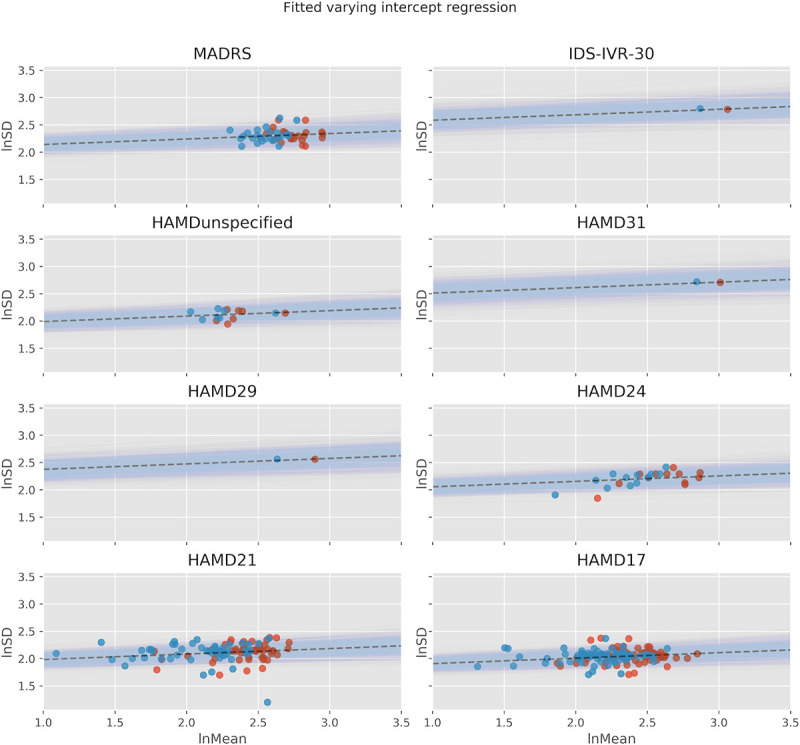
Fig 4. Linear association between lnMean and lnSD.

Linear association between lnMean and lnSD using a varying intercept model, where the intercepts were allowed to vary between studies with different depression scales. Red dots represent active groups, blue dots represent placebo groups.
