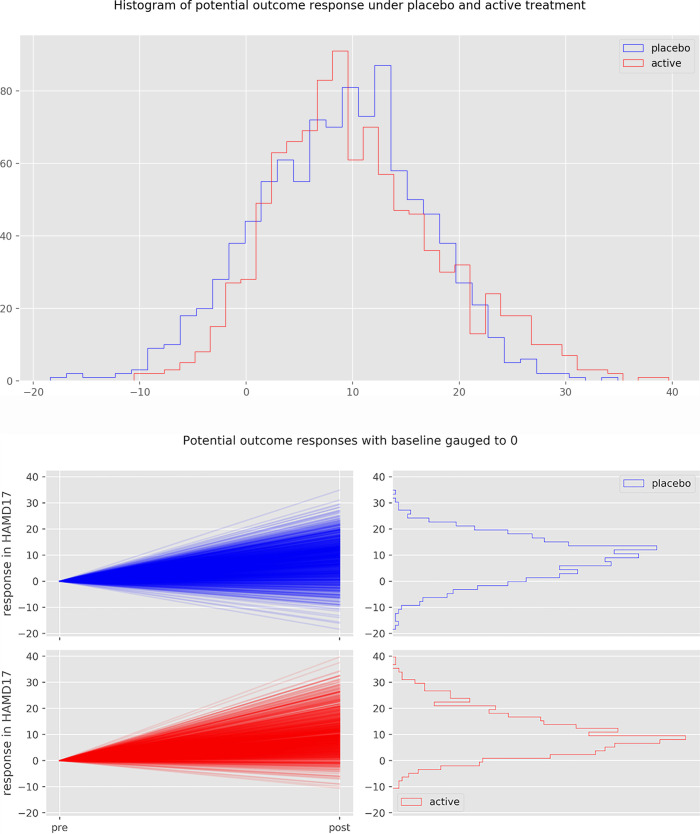
Fig 10. Change score of 1000 simulated patients.
Boxplot (a) of change score under placebo (blue) and under active treatment (red) for ρ = - 0.4, SDte = 6.35 HAMD-17 points and VR = 1.02. (b) depicts pre-post change for each individual patient, gauged to 0. Note, that in this particular simulation, the SDte is not exactly equal to 6.5, as all simulations contain random processes.

