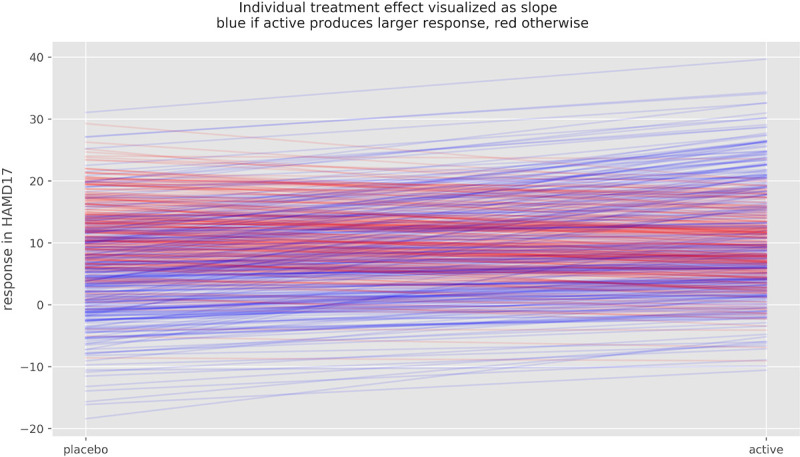
Fig 11. Potential outcomes and individual treatment effect of 100 simulated patients.

Potential outcome under placebo and under active treatment of 100 simulated patients, ρ = - 0.4, SDTE = 6.35 and VR = 1.2. Slopes represent individual treatment effect, which varies substantially in this simulation. Blue lines indicated improvement under active treatment, red lines deterioration.
