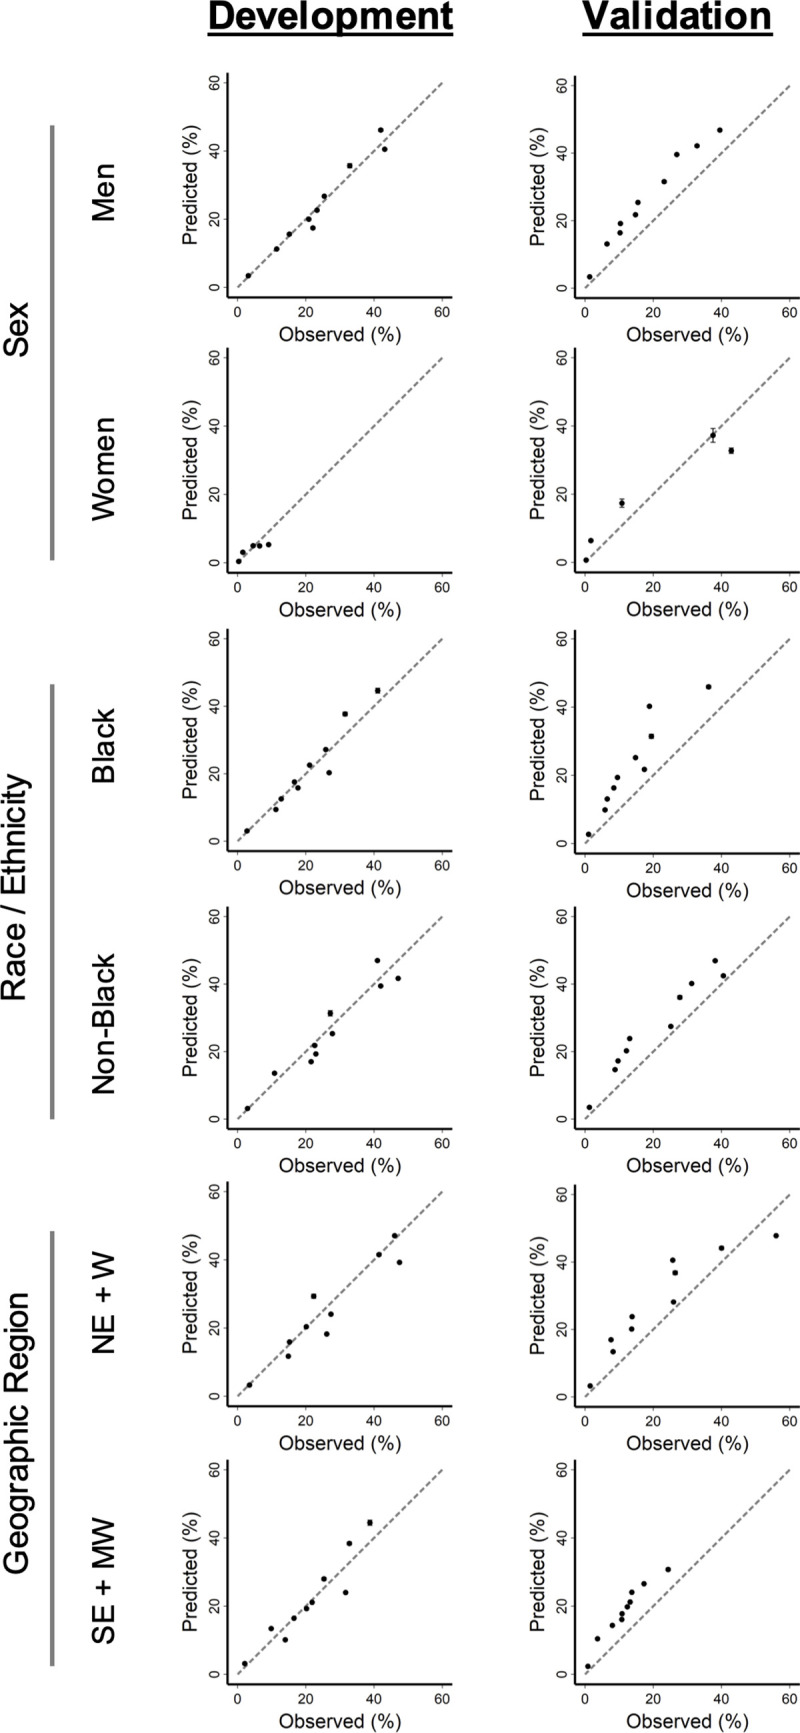
Fig 4. Calibration plots of VACO Index: Combined cohort subgroups.

Calibration plots of VACO Index 30-day predicted mortality risk versus observed patient mortality. Error bars show 95% confidence intervals and dashed lines indicate perfect agreement between predicted versus observed patient mortality. Development cohort: test positive between March 2 and April 15, 2020, n = 3,681, 480 deaths. Combined early and late validation cohorts: test positive between April 16 and July 18, 2020, n = 9,642, 656 deaths. Subgroups: Men vs women; Black vs non-Black race; Northeast (NE) + West (W) regions vs Southeast (SE) + Midwest (MW) regions.
