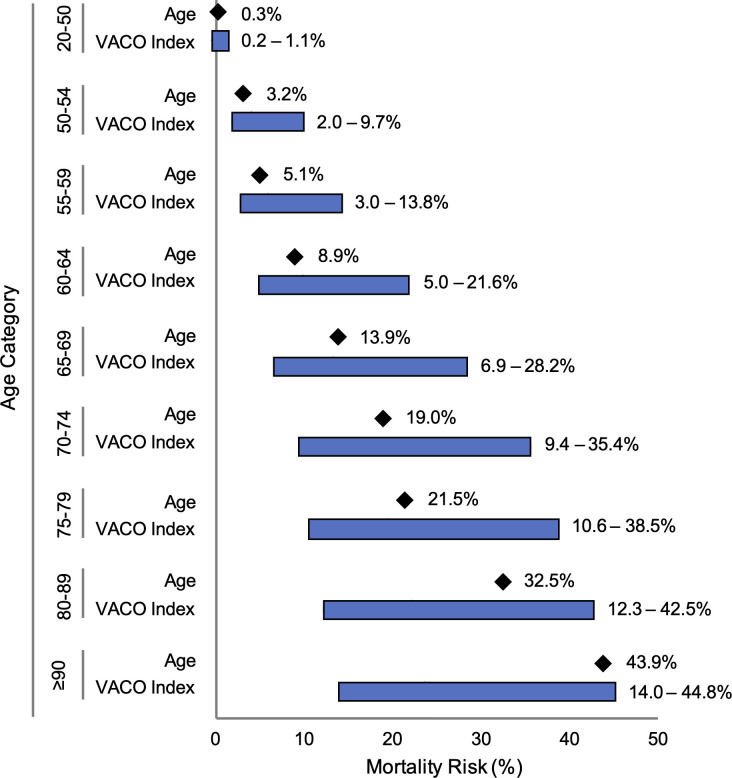
Fig 5. Range of 30-day mortality predictions from age alone and VACO Index.
Bar graphs demonstrating the additional variation in mortality prediction provided by the VACO Index over age alone across age categories in the combined validation cohort (n = 9,642). The diamonds indicate predicted 30-day mortality within each age category when only age is used to generate the predicted value. The bars show the range of predicted 30-day mortality within the same age category provided by the VACO Index, where age is supplemented with sex and comorbidities.

