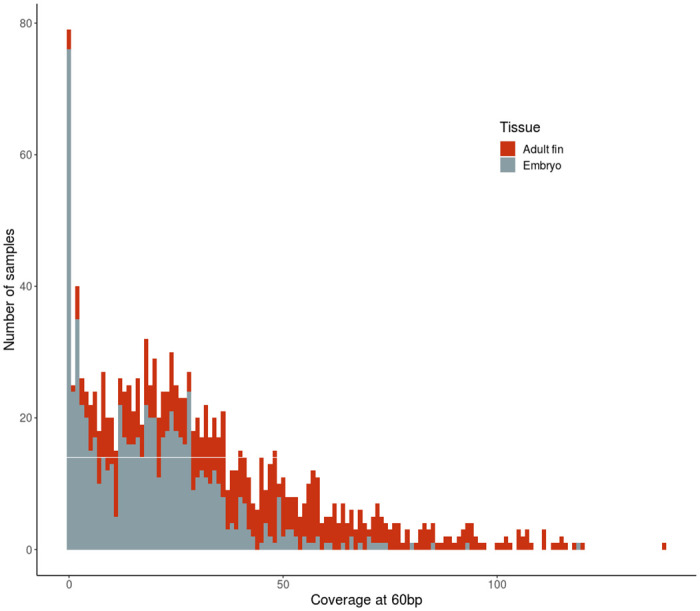
Fig 2. Sample sequencing coverage.

Histogram of the mean coverage of samples at midway position of all 500 bait-targeted loci. The midway position was 60bp in the 5’-3’ direction from the start position of the capture bait.

Histogram of the mean coverage of samples at midway position of all 500 bait-targeted loci. The midway position was 60bp in the 5’-3’ direction from the start position of the capture bait.