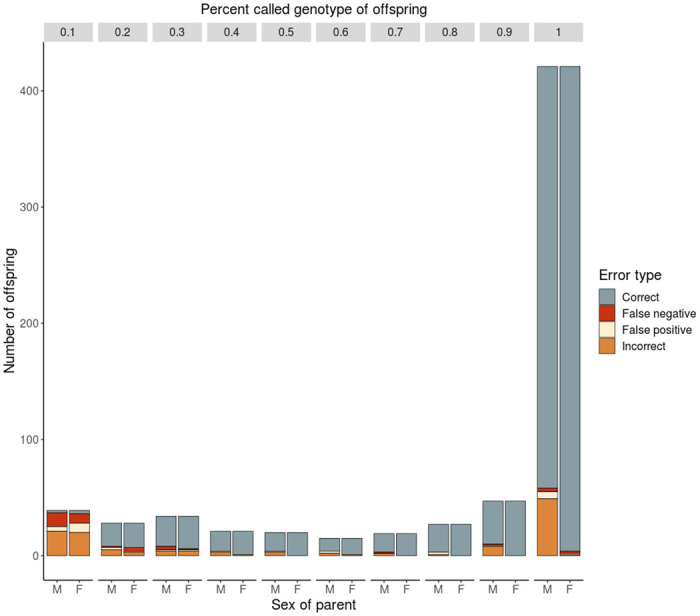
Fig 3. Error analysis of parentage assignments.

Stacked bar plot of assignments of parents to offspring compared to the observed hatchery spawn; grouped by closest tenth of a percent of called genotypes of offspring; errors separated by sex of parent M—male, F—female; shade indicates error type: correct, false negative (no parent assigned when one was present), false positive (parent assign when not present), and incorrect (parent assigned to incorrect parent when parent present).
