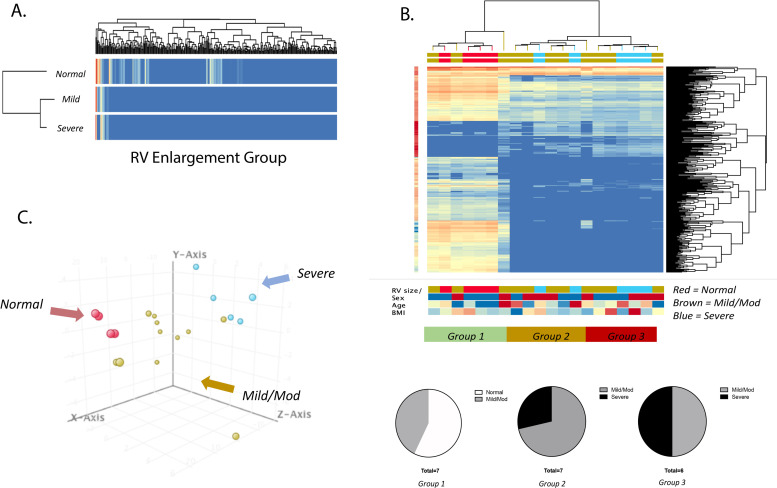
Fig 3. Hierarchical clustering of patients based on miRNA expression shows relationship to RV size.
(A) Heatmap of groups based on echocardiography into normal RV size (N = 4), mild-moderate (N = 11) and severe RV enlargement (N = 5). (B) Unbiased hierarchical clustering based on differentially expressed miRNA identifies three distinct groups: Group 1—patients with mostly normal RV size, Group 2 –patients with mostly mild-moderate RV enlargement and Group 3 –patients with mild-moderate and severe RV enlargement (ANOVA FDR < 0.05). (C) Principal component analysis of individual patients demonstrates clustering of patients based on miRNA global profile (red = normal, brown = mild/mod, blue = severe). RV–right ventricle.

