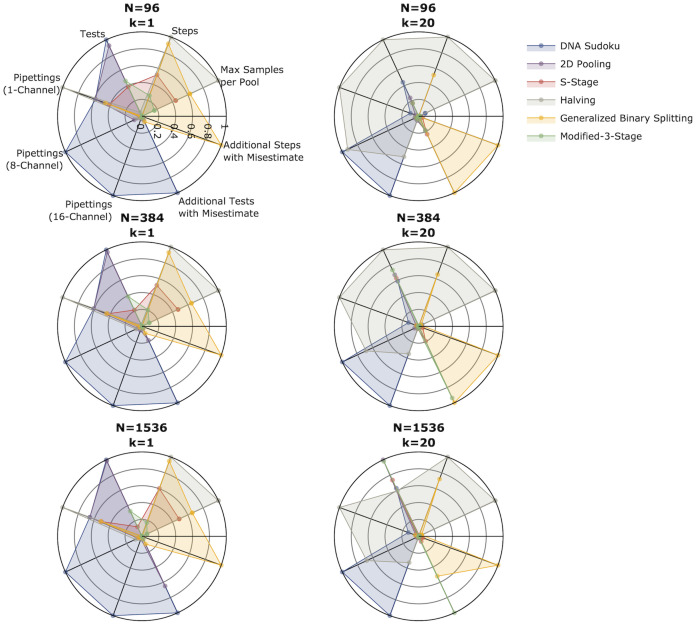
Fig 6. Comparison of five pooling methods.
The radar charts show the average number of tests, number of steps, maximum number of samples per pool, number of pipettings (for 1-, 8- and 16-channel pipettes), and the number of additional tests and steps required when the number of positive samples is overestimated (k = 1, ) or underestimated (k = 20, ). The left column shows results from simulations with one positive sample and the right column shows simulations with 20 positive samples. The rows are different sample sizes from top to bottom: 96, 384, and 1,596. In each plot the values for each feature have been Min-Max normalized. In each category, methods with points at the center performed the best while methods with points near the edge performed the worst.

