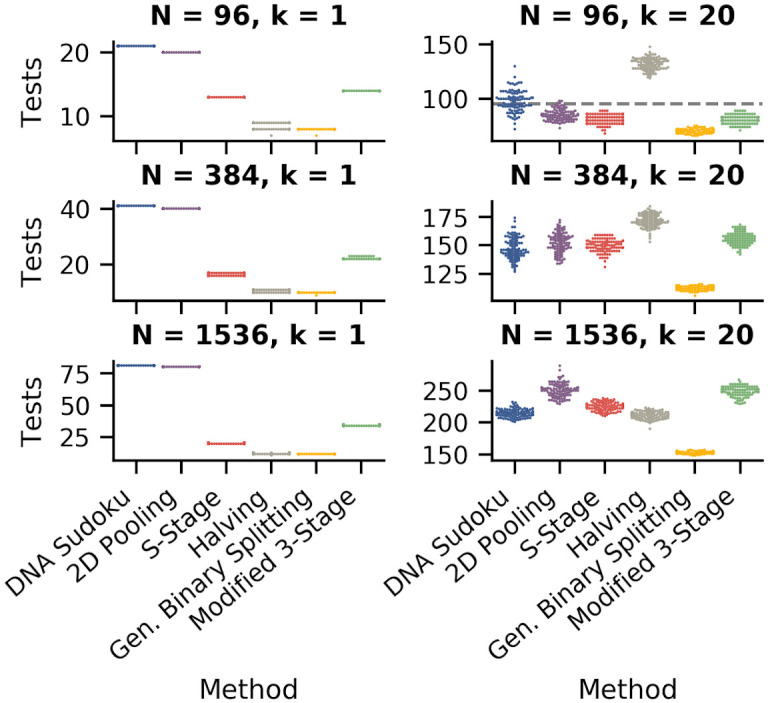
Fig 7. Comparison of the number of tests required for each pooling method.

The swarm plots show the distribution of the number of tests required for each method (100 simulations each). The left column shows simulations with one positive sample and the right column shows simulations with 20 positive samples. The rows are different sample sizes from top to bottom: 96, 384, and 1,596. For the S-Stage, Modified 3-Stage, and General Binary Splitting approaches, the results shown are for simulations where the expected number of positive samples was the same as the true number of positives. For DNA Sudoku and 2D Pooling, the results shown are for simulations with parameters that resulted in the lowest average number of tests (DNA Sudoku: w = 2 when k = 1, and when k = 20, w = 3 for 96 samples and w = 4 for 384 and 1,536 samples; 2D Pooling: when k = 1, the grid sizes shown are 1x10x10 for 96 samples, 1x20x20 for 394 samples, and 1x40x40 for 1536 samples, and when k = 20 the grid sizes are 11x3x3 for 96 samples, 24x4x4 for 384 samples, and 96x4x4 for 1,536 samples).
