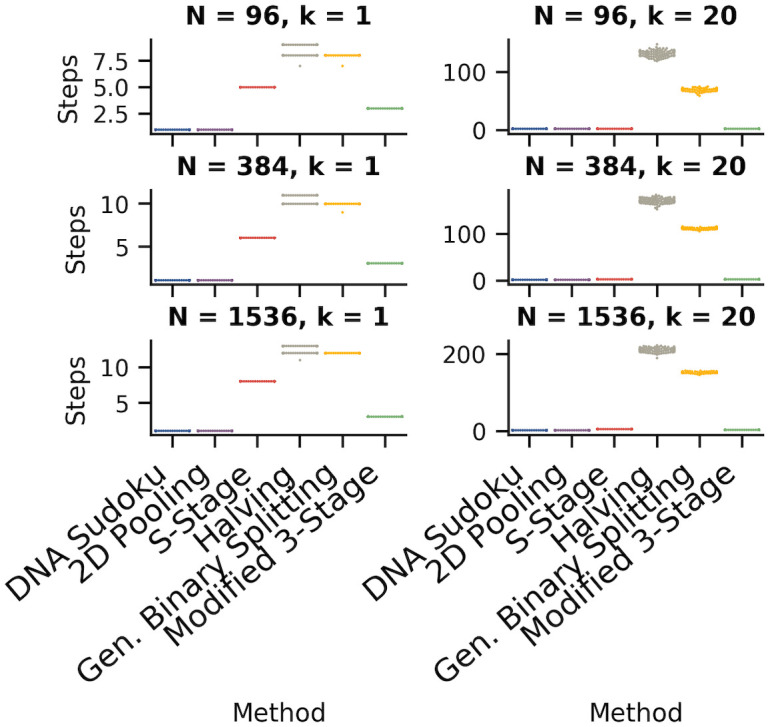
Fig 8. Comparison of the number of steps required for each pooling method.

The swarm plots show the distribution of the number of steps required for each method (100 simulations each). The left column shows simulations with one positive sample and the right column shows simulations with 20 positive samples. The rows are different sample sizes from top to bottom: 96, 384, and 1,596. The results are from the same set of simulations as shown in Fig 7.
