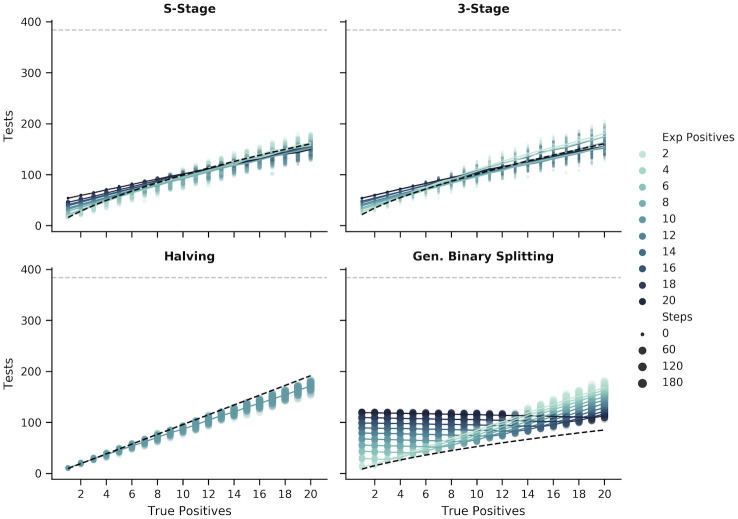
Fig 11. Changes in the number of tests and steps given different estimated positive rates for the adaptive methods.
The figure shows the number of tests (y-axis) and the number of steps (marker size) required to recover all positive samples (x-axis) in simulations with N = 384 samples using each of the adaptive methods. For each method, except for Binary Splitting by Halving, the pooling scheme was optimized around the expected number of positive samples (marker color) provided to each simulation. Each point represents a single simulation and the lines are the average number of tests for a given number of expected positives. The black dashed line in the S-Stage, 3-Stage, and Binary Splitting by Halving figures represents the upper bound of the number of tests (assuming that the number of positive samples is estimated correctly, where applicable). For the Generalized Binary Splitting figure, the number of tests approaches the lower bound (black dashed line) when is large.

