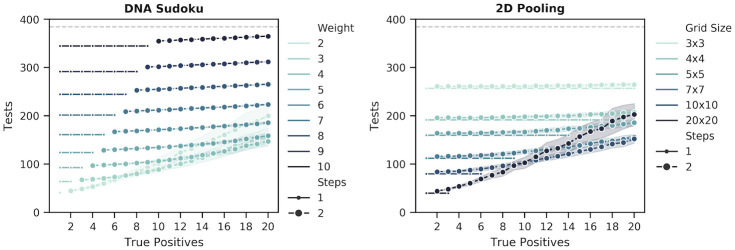
Fig 12. Changes in the number of tests and steps given different estimated positive rates for the non-adaptive methods.
The figure shows the number of tests (y-axis) and the number of steps (marker size) required to recover all positive samples (x-axis) in simulations with N = 384 samples using DNA Sudoku and 2D Pooling methods. Each point is the average number of tests required for 100 simulations and the width of the bands is the standard deviation. The simulations were run using different weights for DNA Sudoku and different symmetrical 2D grid sizes for 2D Pooling. Small markers indicate unambiguous results that required only a single round of testing and the larger markers indicate ambiguous results that required a second validation step to correctly identify the positive samples. The grey dashed line is the number of tests required for individual testing.

