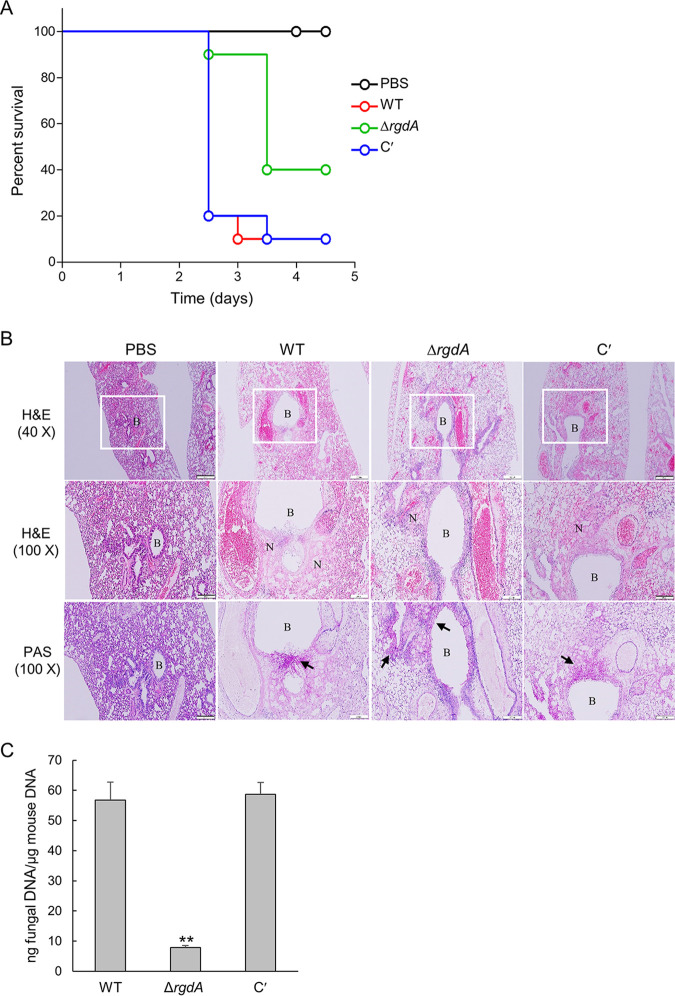
FIG 8.
A role of RgdA in virulence. (A) Survival curve of mice infected with WT, ΔrgdA, and complemented (C′) strains (n = 10/group). (B) Lung sections were stained with H&E or PAS. B, bronchiole; N, necrosis. The arrow indicates fungal mycelium. Bars, 200 μm (40×) and 100 μm (100×). (C) Fungal burden in the lungs of mice infected with WT, ΔrgdA, and complemented strains. Data are means and standard deviations from three independent experiments. **, P < 0.01 (ANOVA).

