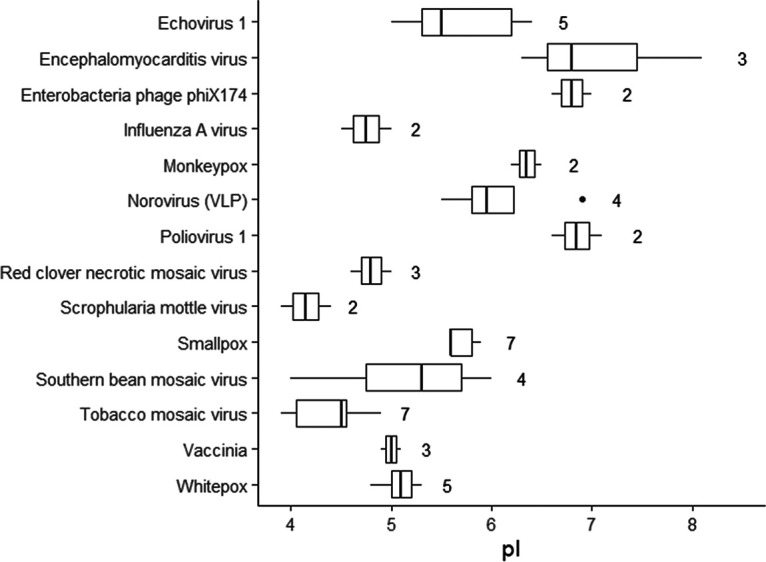
FIG 1.

Relative conservation of isoelectric point (pI) in closely related virus strains. The plot shows empirical pI values for different strains of the same species, with the number of strains shown to the right of each box (data summarized from Michen and Graule [7]). To minimize differences due to experimental conditions, pI values for each virus along the y axis were obtained from single studies comparing different strains.
