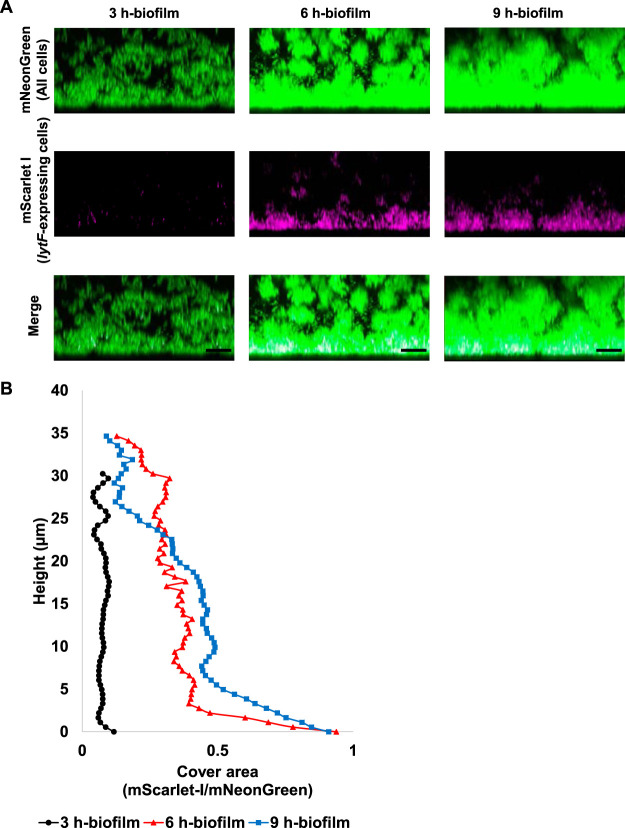
FIG 4.
The distribution of lytF-expressing cells in the biofilm is maintained near the bottom even when the culture time is extended. The Pldh and PlytF dual-reporter strain was grown in an aerobic atmosphere containing 5% CO2 at 37°C in BHIs with sCSP for 3, 6, or 9 h in glass-bottom dishes. Nonadherent cells were removed by washing twice with PBS. Areas of approximately 40 μm from the surface were observed using an inverted CLSM. Z-stacks were acquired at 0.5 μm intervals. (A) Images showing side views of the biofilms. Since the samples for each culture time were individually prepared, these images are not in the same field of view. mNeonGreen (all cells) and mScarlet-I (lytF-expressing cells) are shown in green and magenta, respectively. The scale bars indicate 10 μm. Representative images from independent experiments are presented. (B) Image analysis of the biofilms in panel A. In each two-dimensional image, the cover areas showing the fluorescence of mScarlet-I (lytF-expressing cells) and mNeonGreen (all cells) were calculated by ImageJ and Fiji.

