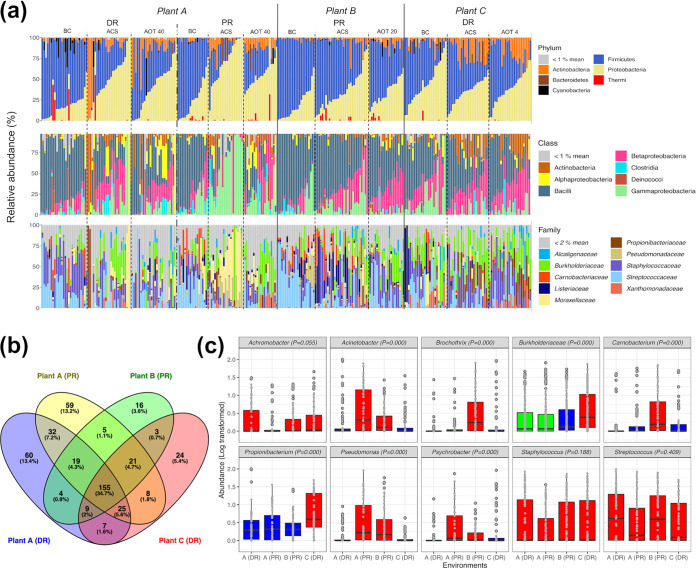
FIG 1.
(a) Stacked bar plots showing the microbiota composition (relative abundance) in phylum, class, and family taxon ranks, with a color coding key; samples are grouped according to the origin (plant and room type) and then according to the temporal phase (BC, ACS, or AOT). (b) Venn diagram displaying the number of shared OTUs at the genus level (or the highest taxonomic rank available when genus determination was not achievable) among the four environments considered (A-DR, A-PR, B-PR, and C-DR). (c) Box plots displaying the logarithmically transformed relative abundances of core OTUs in the four environments; Kruskal-Wallis test P values are displayed, and different box plot colors highlight significantly different abundances (P < 0.05 [FDR adjusted], Kruskal-Wallis and Wilcoxon tests).

