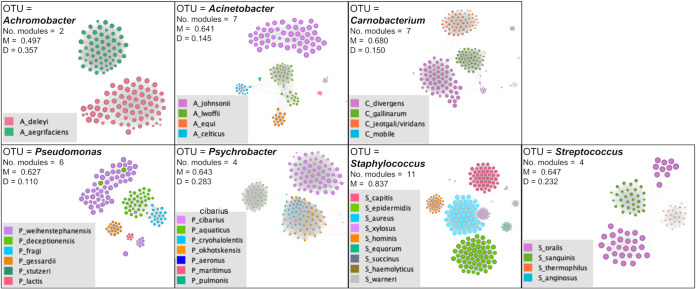
FIG 2.
Co-occurrence networks of bacterial oligotypes belonging to Achromobacter, Acinetobacter, Psychrobacter, Pseudomonas, Propionibacterium, Carnobacterium, Streptococcus, and Staphylococcus. Each network is based on the log-transformed relative abundance matrix of each genus, and the edges represent significant positive correlations (co-occurrence) between the oligotypes (nodes) by means of Spearman’s correlations (rho > 0.6; FDR, P < 0.001). Nodes were made proportional to the weighted degree (total occurrence of an oligotype in the whole data set) and are colored in relation to the species of belonging. Edges were made proportional to the Spearman’s rho value. The M and D values shown in the box represent the modularity (clustering coefficient) and density (calculated using the ratio of the number of edges) of each genus-based network.

