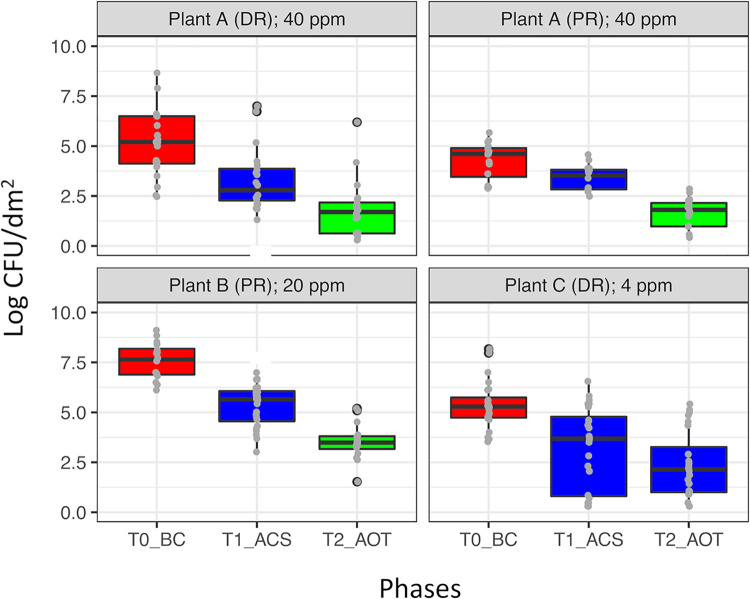
FIG 3.
TVCs detected in the four environments (A-DR, A-PR, B-PR, and C-DR) across the three temporal phases, i.e., BC, ACS, and AOT performed at 40 ppm (A-DR and A-PR), 20 ppm (B-PR), or 4 ppm (C-DR) of ozone (concentrations used are displayed for each environment). Box plot colors highlight significant differences (P < 0.05 [FDR adjusted], Kruskal-Wallis and Wilcoxon tests) among the TVCs of the three temporal phases (BC, ACS, and AOT).

