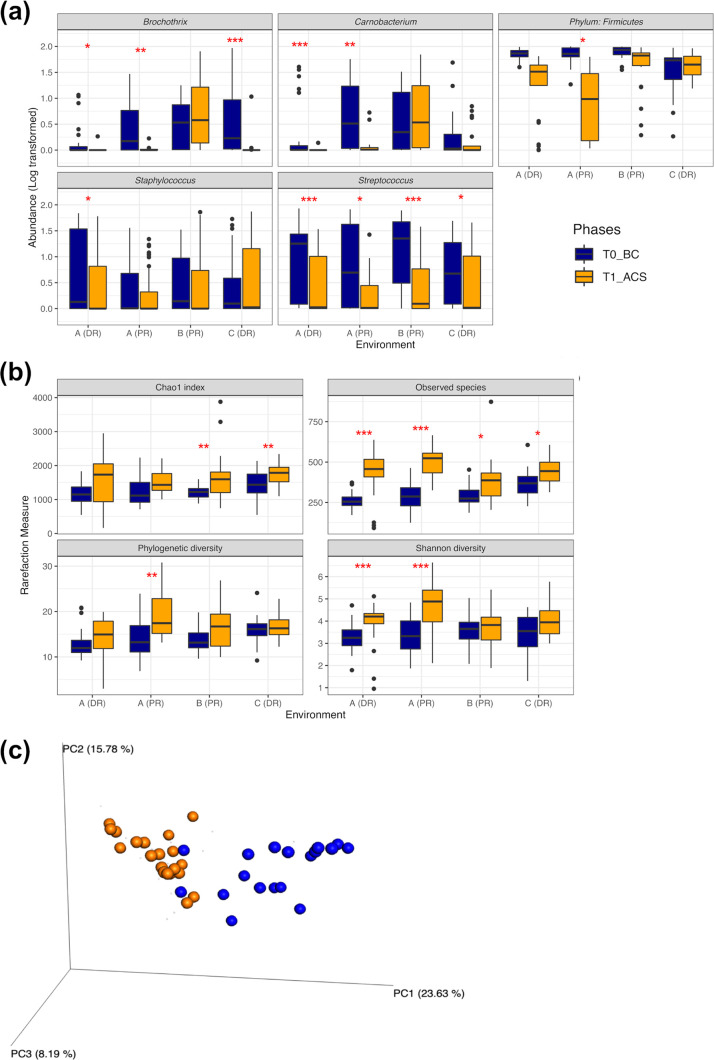
FIG 4.
(a and b) Box plots displaying abundance decreases of the core OTUs (a) and the variations of α-diversity measures (b) that occurred in each environment before (BC) (blue) and after (ACS) (orange) the cleaning/sanitizing phase. Asterisks highlight significant differences (FDR-adjusted P value from Wilcoxon’s test); *, 0.05; **, 0.01; ***, 0.001. (c) PCoA chart displaying the weighted UniFrac distance matrix (β-diversity) of the environment PR of plant A before (BC) and after (ACS) cleaning/sanitizing procedures; BC and ACS are different communities (P < 0.001 [FDR adjusted], ANOSIM and Adonis tests).

