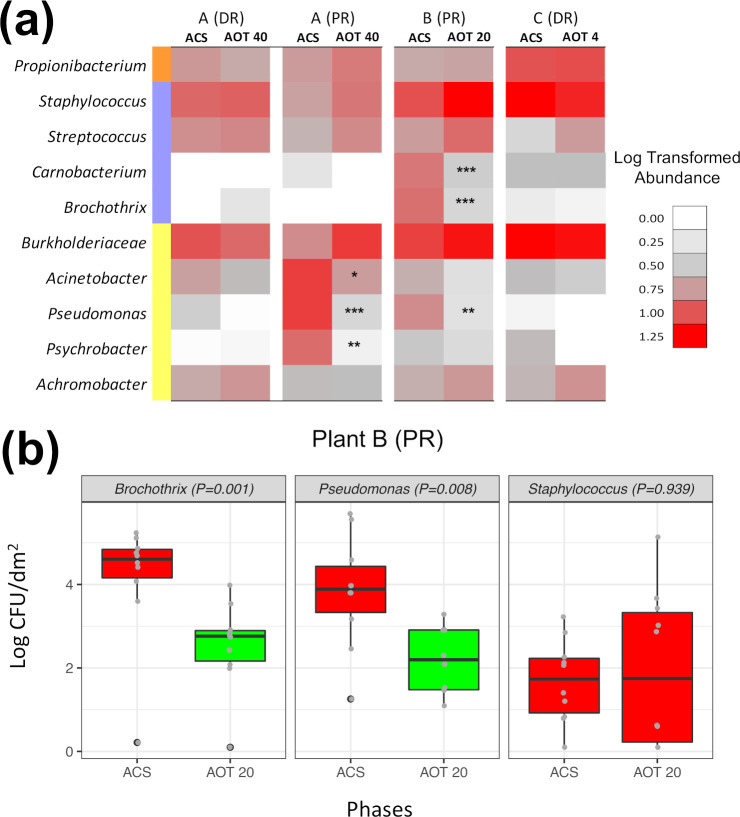
FIG 5.
(a) Pseudo-heatmap summarizing the abundance variations of the 10 core OTUs (>50% of the total abundance in >80% of the samples) occurred during the ozone treatments. Asterisks highlight significant decreases in relative abundances in each environment after ozone treatment at 40, 20, or 4 ppm (FDR-adjusted P value from Wilcoxon’s test). *, 0.05; **, 0.01; ***, 0.001. (b) Viable counts of Brochothrix, Pseudomonas, and Staphylococcus before (ACS) and after (AOT 20) the 20-ppm ozonation carried out in the environment B-PR; box plot colors highlight significant differences between ACS and AOT 20 counts (P < 0.05 [FDR adjusted], Wilcoxon’s test).

