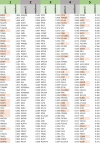
Table 2.
List of genes expressed in each state
 |
Tabulation of genes underlying the heat map of Figure 7c. The top 50 genes most specific to each of the five Monocle-defined cell states are listed in separate columns (because of overlap, there are only total 227 distinct genes in the table). For each gene and state combination, the Fisher specificity metric (one-versus-all score or “ovaScore”) (see Methods) is indicated alongside the gene name.
