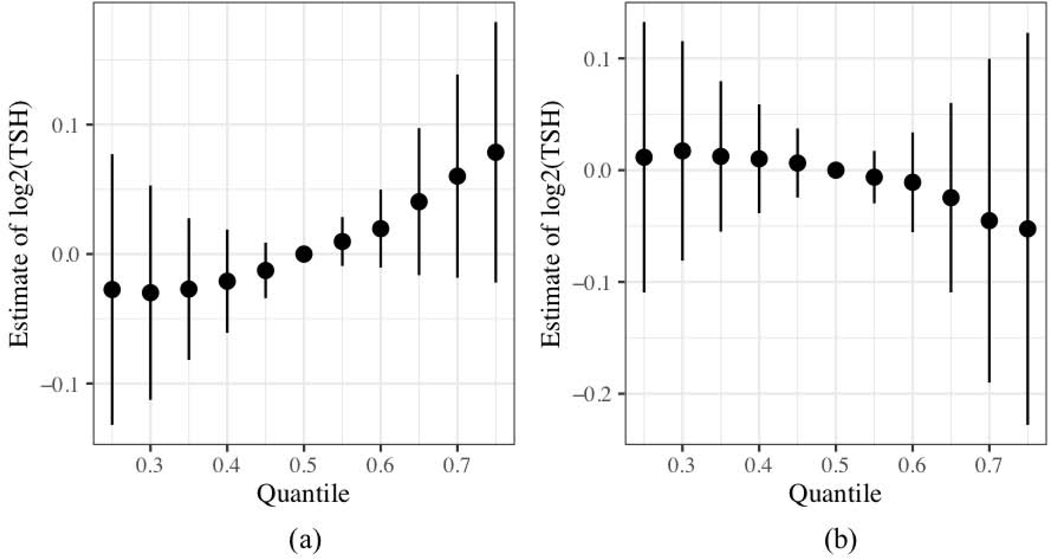
Figure 2:
Adjusted association of the overall PFAS mixture on log2-transformed cord TSH from BKMR. The plots compare the value of the estimate when all the log2-transformed PFAS are at the respective quantile compared to when they are at the median. Variation is expressed using 95% credible intervals. Models include log2-transformed (a) PFOA, PFOS, PFNA, and PFHxS (n = 236) and (b) PFOA, PFOS, PFNA, PFHxS, BDE-28, BDE-47, and PCB-153 (n = 202). The models have been adjusted for maternal age at delivery, race/ethnicity, marital status at baseline, maternal education level, household income, mean log10-transformed cotinine, maternal alcohol usage during pregnancy, nulliparity, maternal body mass index based on pre-pregnancy weight in pounds, the child’s sex, gestational week at blood draw for PFAS measurement, and delivery mode. All predictors and continuous covariates were also centered to 0 and scaled to a standard deviation of 1.

