Figure 2. circZNF827 regulates neuronal marker expression levels.
(A) RT-qPCR analysis evaluating knockdown of circZNF827 with dicer-independent short hairpin RNAs (dishRNAs) in the neuroblastoma cell line L-AN-5. (B) Relative mRNA levels of the neuronal markers TUBB3, MAP2, NEFL, and NTRK2 evaluated by RT-qPCR upon knockdown of circZNF827. The mRNA expression levels were evaluated by RT-qPCR after 4 days of RA-mediated neuronal differentiation. (C) Western blotting (left panels) of TUBB3 and MAP2 upon circZNF827 knockdown. GAPDH was used as loading control. The results of quantification of band intensities from western blots are shown the right panels. One representative western blot and the quantification of three is shown. (D) Cell cycle assay based on flow cytometric measurements of EdU incorporation into newly synthesized DNA in L-AN-5 cells upon circZNF827 knockdown. +RA: differentiated L-AN-5 cells. -RA: undifferentiated L-AN-5 cells. Irr: Irrelevant dishRNA. In all panels, data are depicted as mean ± SD (three biological replicates). p-Values were determined by a two-tailed Student’s t test.
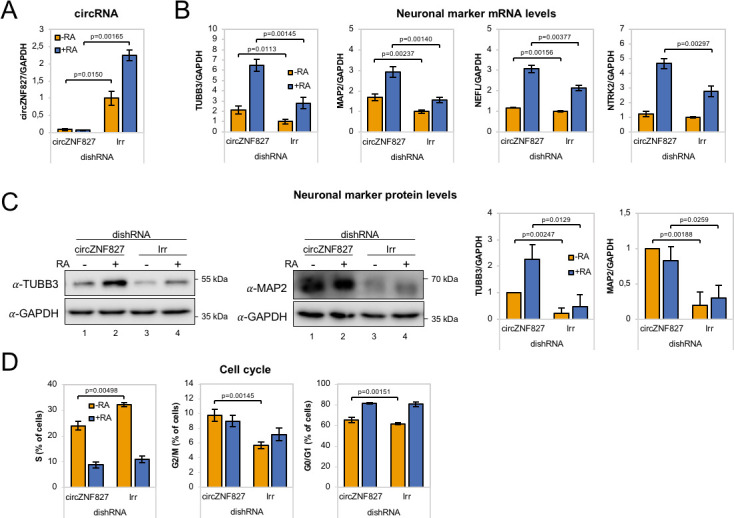
Figure 2—figure supplement 1. Evaluation of circZfp827/circZNF827 knockdown in different cell types and its impact on select neuronal marker expression.
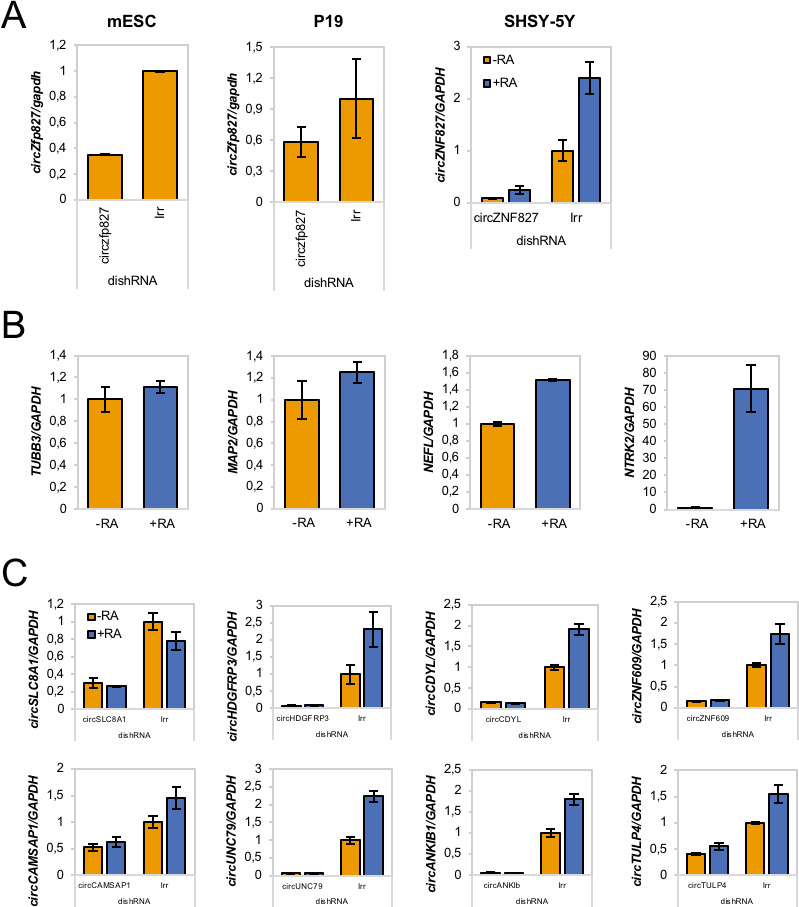
Figure 2—figure supplement 2. mRNA levels of neuronal markers upon circRNA knockdown.
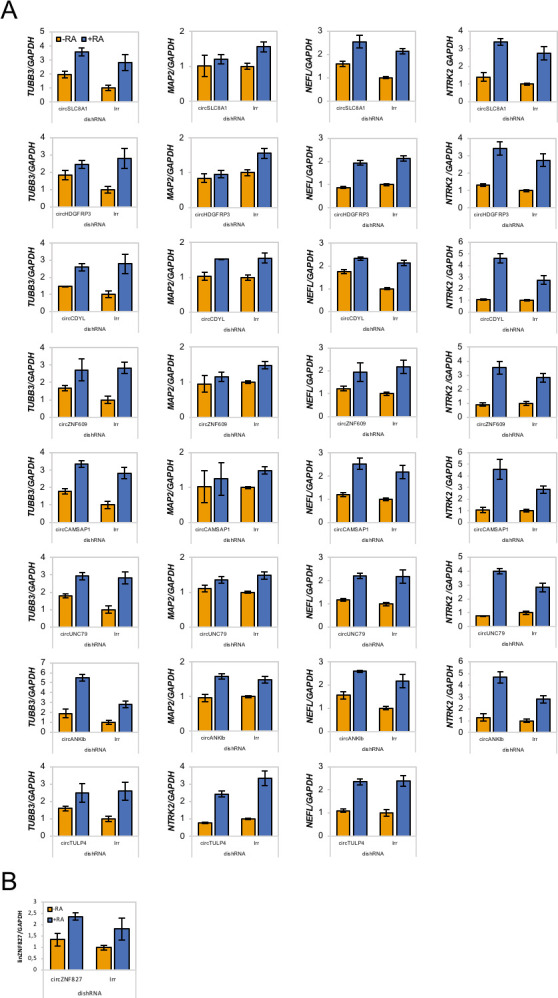
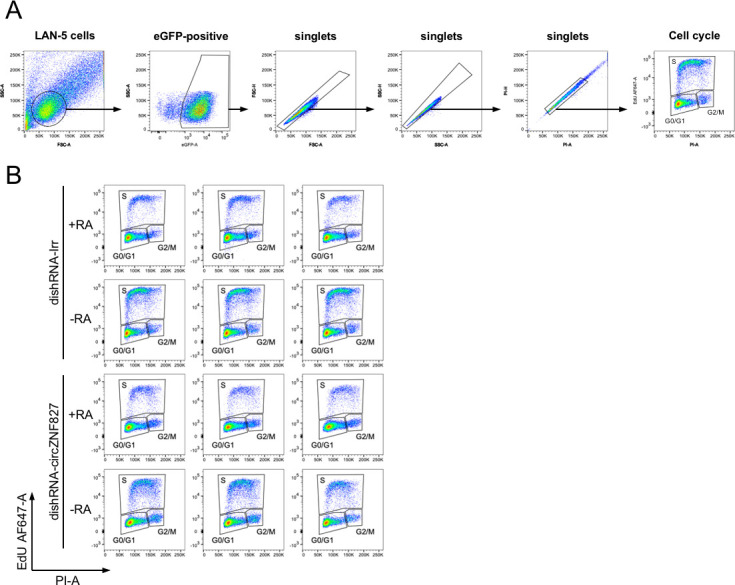
Figure 2—figure supplement 3. Flow cytometric gating strategy and raw data from cell cycle assay.