Figure 1.

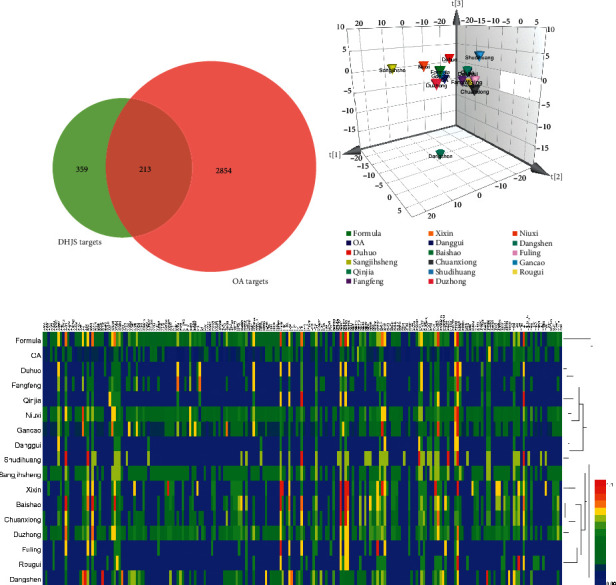
Integrated analysis of DHJS-OA targets. Venn diagram of DHJS and OA targets (a). Scores scatter 3D plot from PCA analysis of DHJS-OA target dataset (b). Heatmap from HCA analysis of DHJS-OA target dataset (c).

Integrated analysis of DHJS-OA targets. Venn diagram of DHJS and OA targets (a). Scores scatter 3D plot from PCA analysis of DHJS-OA target dataset (b). Heatmap from HCA analysis of DHJS-OA target dataset (c).