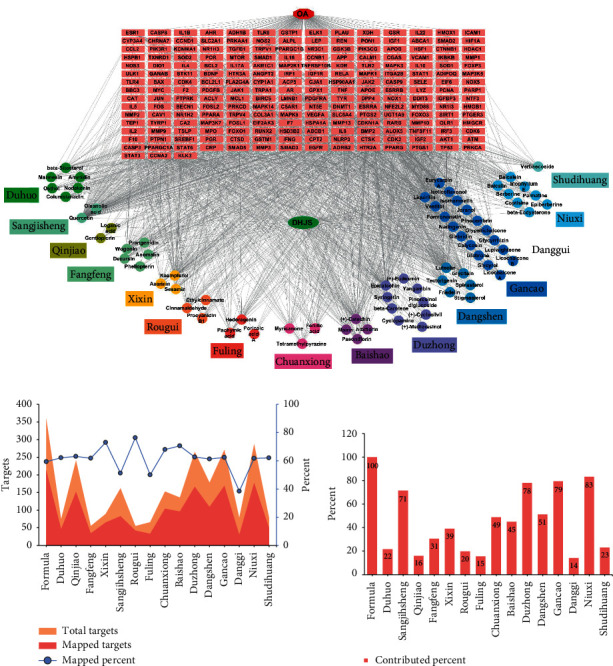
Figure 2.

Network construction and analysis. Network diagram constructed by linking ingredient with putative targets (a). The nodes represent candidate compounds in DHJS which are shown as colorful circle, and the targets are indicated by light red fusiform. The total targets and DHJS-OA mapped targets generated by each herb (b). The contribution of each herb in DHJS formula to the interaction targets (c).
