
Figure 4.
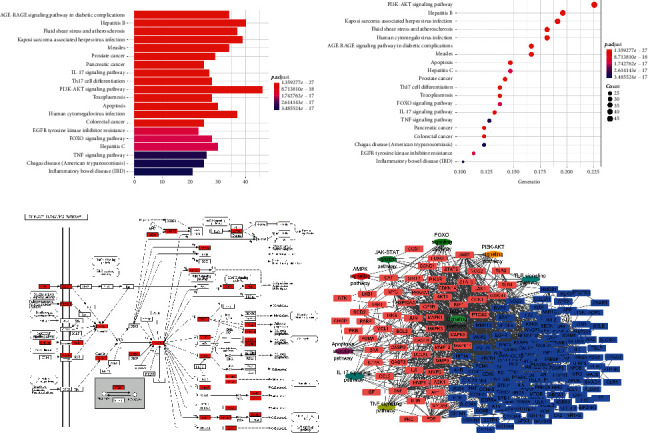
Pathway enrichment analysis. The top 20 pathways extracted based on KEGG enrichment analysis (a). The enriched PI3K-AKT pathway with mapped targets labeled red (b). The target-pathway network for DHJS on OA, in which the red nodes represent the most potential targets and the oval nodes represent the most potential pathways (c).