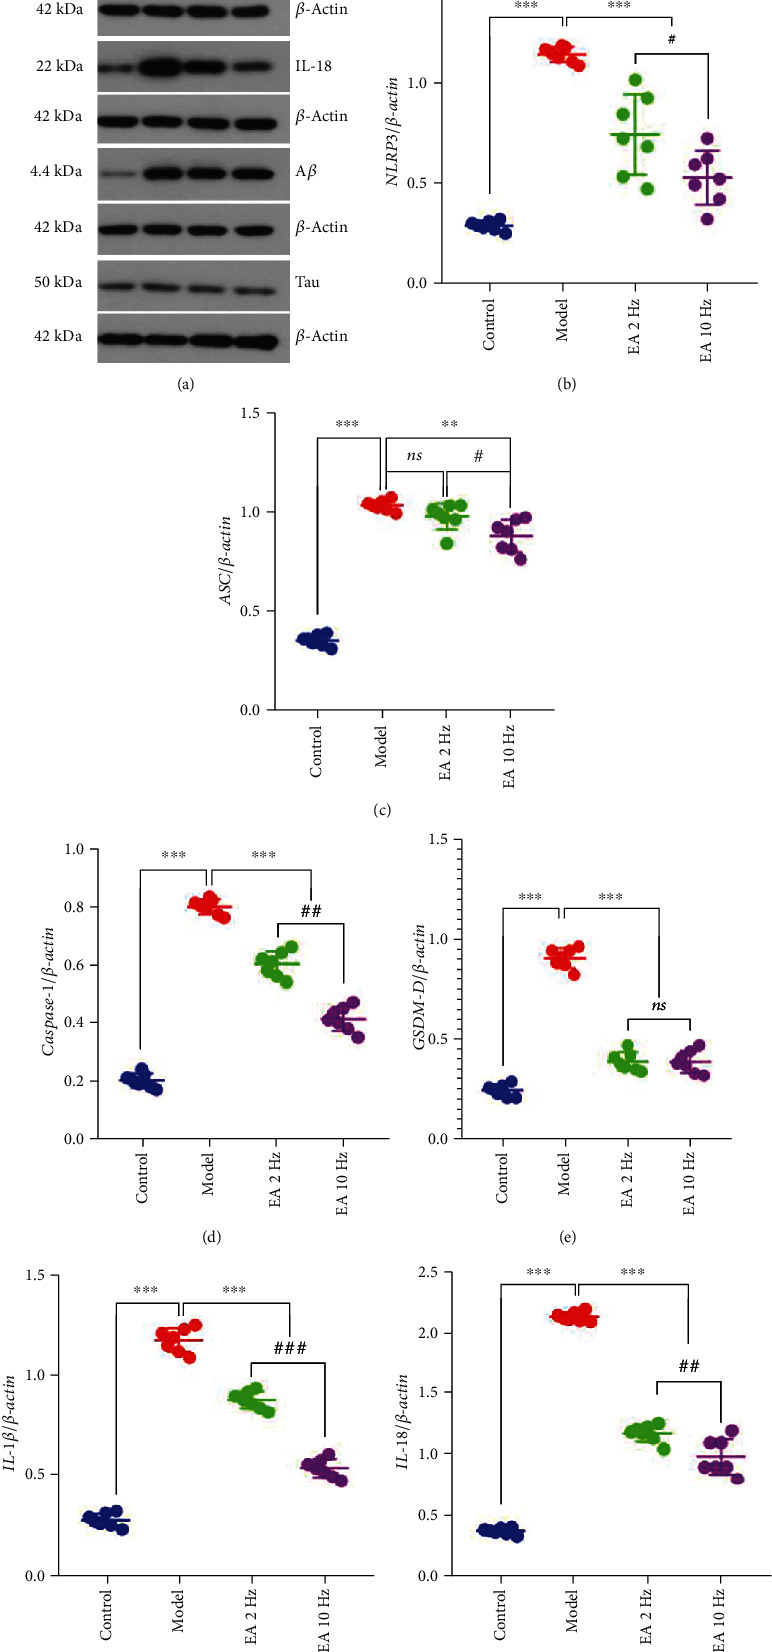
Figure 6.

Expression of NLRP3/caspase-1 signaling-related proteins in the hippocampal tissue. (a) Western blot images showing the protein levels of NLRP3, ASC, caspase-1, GSDM-D, IL-1β, IL-18, Aβ, and tau in the hippocampus. (b–i) Quantification of NLRP3, ASC, caspase-1, GSDM-D, IL-1β, IL-18, Aβ, and tau bands in the hippocampus. Data are presented as the means ± standard error of the mean (n = 7 per group). ∗∗∗P < 0.001 vs. the model group; ###P < 0.001 and ##P < 0.01 vs. the 2 Hz EA group. ns: not significant.
