
Figure 3.
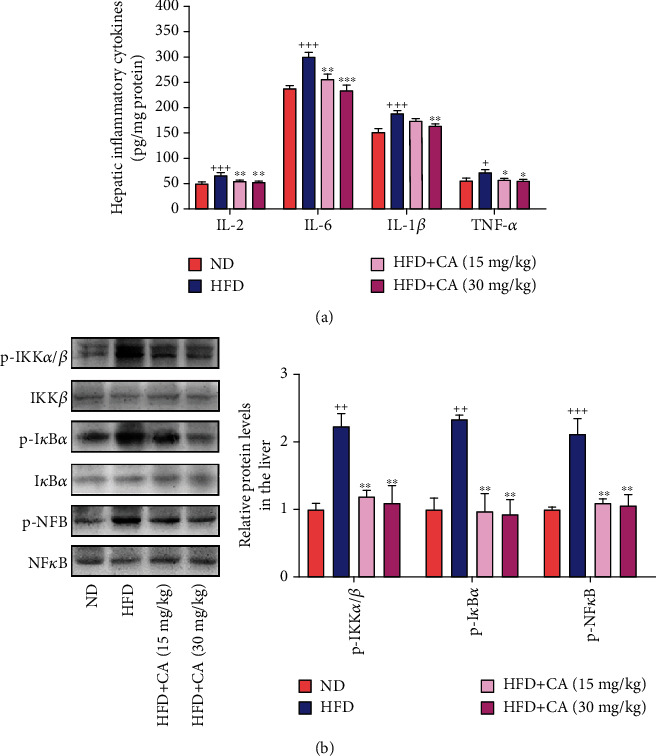
CA suppressed the hepatic NFκB pathway and liver inflammation in HFD mice. (a) Hepatic levels of IL-2, IL-6, IL-1β, and TNF-α (n = 8). (b) Hepatic p-IKKα/β, p-IκBα, and p-NFκB protein levels in mice (n = 3). Data represent the mean ± SEM. ++p < 0.01 and +++p < 0.001 vs. ND group. ∗p < 0.05, ∗∗p < 0.01, and ∗∗∗p < 0.001 vs. HFD group.