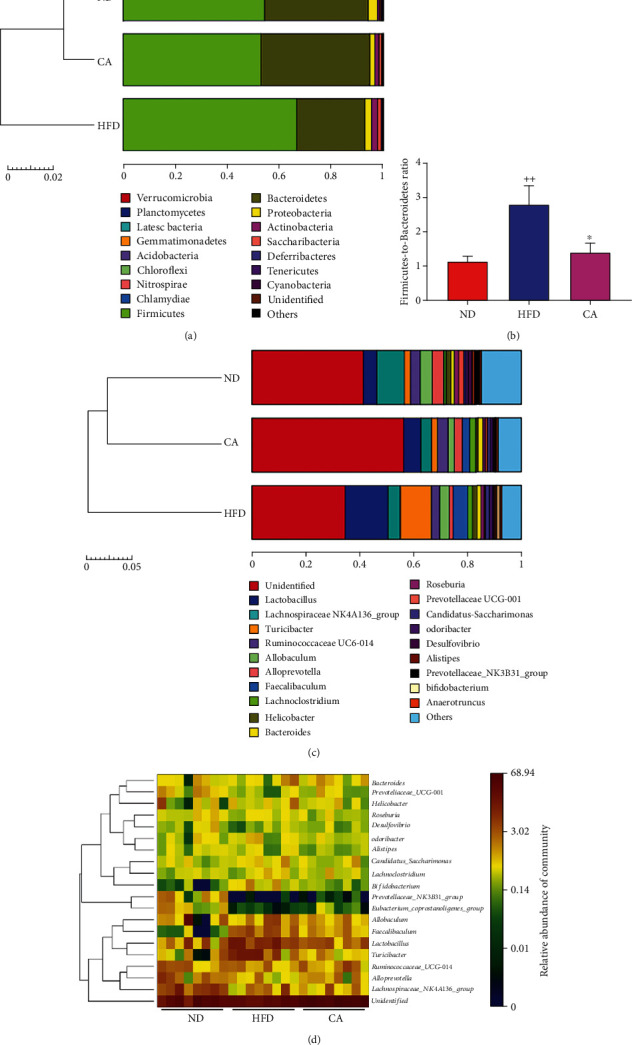
Figure 8.

Effect of CA treatment on the population structure of gut microbiota in HFD mice. (a) Bar plot analysis of microbial community at the phylum level in mice. (b) The alteration in the Firmicutes-to-Bacteroidetes ratio in mice. Bar plot analysis (c) and heat map analysis (d) of microbial community at the genus level in mice. Data represent the mean ± SEM, n = 8 per group. ++p < 0.001 vs. ND group. ∗p < 0.05 vs. HFD group.
