
fig 1.
Patient 6.
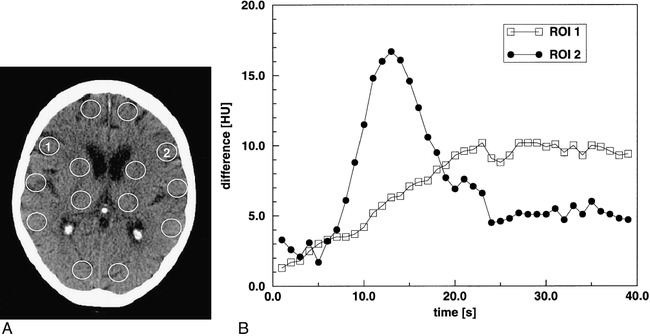
A, Initial native CT scan shows standardized circular ROIs, which were manually placed in both hemispheres in the vascular territories of the ACA, MCA, PCA, the basal ganglia region, and the thalamus.
B, Enhancement-versus-time curves of ROIs 1 and 2 located symmetrically in the anterior vascular territory of the MCA in the ischemic and healthy areas, respectively. Note the strong enhancement peak indicating the passage of the compact contrast bolus in the normal area (ROI 2). Conversely, the time course of the contralateral ROI (ROI 1) shows a markedly delayed and slow enhancement, indicating hypoperfusion.