
fig 1.
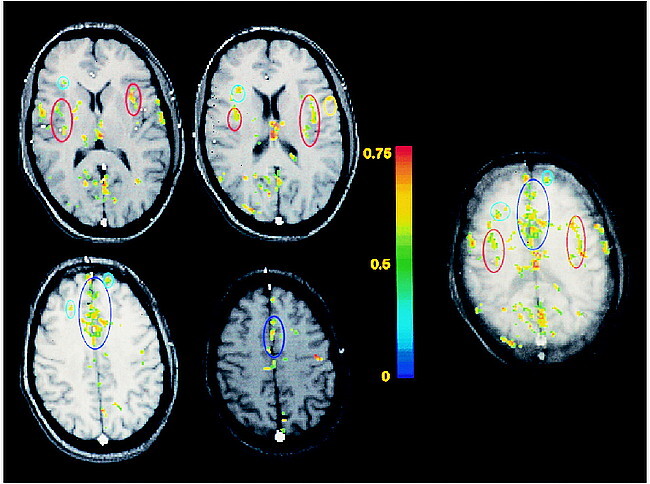
Typical functional maps of rectal pain. The maps located to the left of the color scale display the functional responses obtained within four adjacent individual sections, each 7-mm thick. The map located to the right of the color scale is the functional projection map corresponding to these four sections (thickness of the projected volume is 28 mm). The functional responses within the insulae, anterior cingulate gyrus, and prefrontal cortex are delineated in red, dark blue, and light blue, respectively. The color scale represents the cross-correlation between the temporal evolution of the pixels and a reference waveform representing the block paradigm applied.