
fig 3.
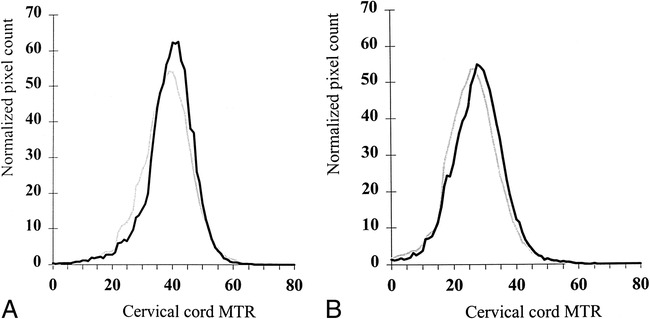
MTR histograms of cervical cord from controls (black line) and entire MS cohort (gray line). Graph A shows MTR histograms from axial, 5-mm-thick slices, graph B shows MTR histograms from sagittal, 3-mm-thick slices.
Official websites use .gov
A
.gov website belongs to an official
government organization in the United States.
Secure .gov websites use HTTPS
A lock (
) or https:// means you've safely
connected to the .gov website. Share sensitive
information only on official, secure websites.
MTR histograms of cervical cord from controls (black line) and entire MS cohort (gray line). Graph A shows MTR histograms from axial, 5-mm-thick slices, graph B shows MTR histograms from sagittal, 3-mm-thick slices.