
Figure 3.
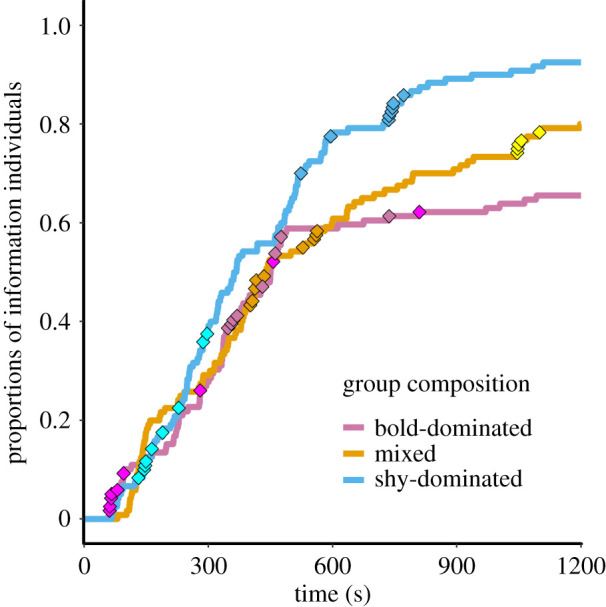
Diffusion curves. Lines indicate the proportion of individuals that had solved the task across all groups of a given personality composition as the trials progressed. Diamonds indicate solving events for a subset of six groups (colours represent different groups).